DDS Insights
There are two key parameters used to render data in DDS Insights:
- Date Picker (From and To): Allows users to define a specific date range for generating and viewing data accordingly.
- Entities Field: Enables users to select one or more offices for which they want to view insights.
By default, the most recent available AP date with corresponding data will be selected, while future AP dates will remain disabled.
Finance Tab
The Finance tab presents comprehensive financial analytics, including key metrics such as Gross Profit, Revenue, AR Aging, and Total Bill Trends by year. It also features a Revenue vs. Gross Profit Projection chart and detailed Finance Tables comparing current and previous period projections.
Additionally, a Top 5 Clients by Gross Profit table is provided, displaying multiple performance indicators such as Total Bill, Total Hours, Gross Profit Percentage, GP per Hour, and related variations for better financial visibility.
Available Tiles in Finance Tab are:
Note: All tile values represent tenant-level data.
- Total Bill: Sum of all billed amounts from timesheets for the accounting period; represents total amount billed to customers for this period.
- Total Hours: Total billable hours recorded during the accounting period.
- Gross Profit (GP): Gross Profit is the remaining revenue after all payroll and employer costs are deducted for that accounting period.
- GP Percentage: Gross Profit Percentage is a profitability metric that represents the percentage of the total billable amount retained as gross profit after accounting for sales, charges, adjustments, discounts, payroll costs, and other associated costs
- GP Per Hour: Calculated as Gross Profit divided by Total Bill Hours (if hours > 0); represents average gross profit per billable hour.
- New Revenue: Total invoice amounts from clients invoiced for the first time during the accounting period.
- Lost Revenue: Lost Revenue refers to the revenue that was expected but not generated from a customer during a specific accounting period.
- AR Aging Block: Contains metrics related to AR aging—such as ARBalanceOrganizationCurrent, ARBalanceOrganization1To30, ARBalanceOrganization31To60, and others—at the tenant level.
Note: All tiles in finance tab except AR aging tile bucket are based on date range, while AR Aging Tile bucket is based on “As of Date” Logic. When a date range is selected in date filter, for AR Aging Tile bucket the end date of date filter will be the “As of Date”.
Similarly, if in the selected date range there are multiple closed Accounting periods the tiles will display sum those Accounting periods except for AR aging tile bucket.
Trend line graph
- Total Bill by Year: Shows the total billed amounts from timesheets for each accounting period over the past three years (Current year and past two years). The X-axis represents monetary value, the Y-axis represents week number, and the chart legend distinguishes the years. (Date range filter is not applicable for this trend lines)
Stacked Bar Graph
- Revenue Vs Gross Profit By Office: This chart shows the data as per the office which shows the comparison of total bill (revenue) and gross profit in graphs for the date range and selected offices. The chart also displays the gross profit percentage by office.
Financial Data By Office
The Finance Table displays key financial metrics such as Total Bill, Gross Profit, and Gross Profit per Hour, for each selected office. For every metric, the table shows:
- Current Period Value
- Previous Period Value
The grid view also includes a Previous column for each data point. This column will display values based on the same logic as the selected date range, i.e., if the user selects a one-month range, the Previous column will show data from the prior one-month period; if a one-week range is selected, it will reflect the data from the previous week, and so on.
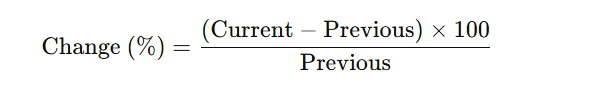
- Percentage Change between the two periods
The percentage change is calculated using the formula:
Visual Indicators
- Green background → indicates a positive change (improvement)
- Red background → indicates a negative change (decline)Top 5 Clients by Gross Profit
Top 5 Customers by Office
As the name suggests, this section displays the top five organizations ranked by Gross Profit for each selected office.
The table includes the Current Period, Previous Period, and Percentage Change values for Gross Profit and other metrics, calculated using the same formula as in the Finance Table:

All other functionalities — including the search option, green and red color indicators (for positive and negative changes), and data display style — are kept consistent with the Finance Table for a unified user experience.
Note: In the Top 5 Customers by Office table, values from all departments are consolidated under their respective parent organization. Therefore, the table displays data at the root organization level rather than the individual department level.