Summary
The Look Back Comparison Report shows how key payroll and billing metrics have changed over time, by placing successive time periods side-by-side as columns. Users choose one or more metrics — such as Gross, Gross Profit, Payroll Cost, Sales, or Total Bill — and a comparison interval (Weekly, Monthly, Quarterly, or Yearly), and the report pivots every period that occurred in the selected date range into its own column.
At a glance, the report shows each selected metric broken out by Company, Office, and Customer, with one row per metric per grouping and one column per time period, making growth or decline immediately visible without having to run and reconcile multiple separate date-range reports.
This report is essential for:
Finance & Executive Leadership: reviewing period-over-period performance trends in gross wages, gross, and sales at the company or office level.
Branch & Office Managers: monitoring payroll cost, workers' compensation cost, and billing trends for their location over time.
Sales & Account Managers: tracking customer account growth or decline across periods, including rolled-up totals for parent/child customer relationships.
By using this report, staffing agencies can spot emerging trends early, support business reviews with a single consolidated view, and make more informed decisions about staffing allocation and account strategy.
Report Overview
Attribute | Details |
|---|---|
Purpose | Provides a side-by-side comparison of one or more selected payroll/billing metrics (e.g., Gross, Gross Profit, Payroll Cost, Sales, Total Bill, Total Pay, WC Cost, Employer Taxes) across successive time periods, grouped by Company, Office, and Customer. |
Classification | Business-Critical Report |
Who Should Use This Report | Finance Managers, Branch/Office Managers, Sales and Account Managers, Executive Leadership |
Business Problem Solved | Enables period-over-period trend analysis without manually pulling and reconciling multiple date-range reports; highlights performance shifts by customer, office, or company in a single pivoted view. |
Run Frequency | On demand, typically during monthly, quarterly, or annual business reviews |
Related Reports | Payroll Journal, Gross Profit Summary |
Business Value
Category | Description |
|---|---|
Trend Identification | Surfaces growth or decline in Gross, Sales, or Gross Profit across periods at the customer, office, or company level. |
Customer Profitability Tracking | Optionally rolls up figures to the parent/root customer so whole-account performance can be tracked over time, not just individual child customers. |
Workforce Cost Monitoring | Compare Payroll Cost, WC Cost, and Employer Taxes period-over-period to catch unexpected cost increases early. |
Flexible Period Grouping | Users choose Weekly, Monthly, Quarterly, or Yearly comparison, matching the granularity needed for the review. |
Multi-Metric Comparison | Multiple financial metrics can be selected and compared side-by-side in a single run, rather than one report per metric. |
Known Issues or Limitations
Issues | Description |
|---|---|
Only closed transaction batches are included | Transactions in batches that have not yet been closed are excluded, so recently processed payroll may not appear until the batch closes. |
Zero-value transactions are excluded | Transactions where both Total Pay and Total Bill equal zero are filtered out, which may omit certain adjustment-only or non-monetary transactions. |
Empty periods do not appear as zero columns | If no qualifying transactions occurred in a given period within the date range, that period is omitted entirely rather than shown as a zero-value column. |
Selecting many metrics increases complexity | Each metric chosen in Column to Compare is dynamically pivoted; selecting a large number of metrics or a wide date range can increase report generation time. |
Troubleshooting Guide
Issues | Problem Reason | Solution |
|---|---|---|
No data displayed | The selected date range does not contain any closed transaction batches, or the Company/Office filters do not match any processed data. | Confirm the relevant batches are closed. Widen the date range or check the Company/Office filters. |
An expected period column is missing | No qualifying transactions occurred in that period, or the wrong Date Type was selected. | Confirm transactions were posted in that period. Check whether Accounting Period Date or Pay Period End Date is the correct Date Type for the comparison. |
Customer totals look combined or higher than expected | Roll Up to Root Customer is set to True, which combines child customers under their parent. | Set Roll Up to Root Customer to False to see individual customer-level detail. |
FAQ
Questions | Answers |
|---|---|
What is the difference between Accounting Period Date and Pay Period End Date? | Accounting Period Date groups transactions by the accounting period they posted to. Pay Period End Date groups them by the end date of the pay period they belong to. Choosing the right Date Type determines which date each transaction is compared by. |
How does Roll Up to Root Customer work? | When set to True, all child customers are combined under their parent (root) customer, so the report shows one combined trend line per parent account. When False, each customer is shown separately. |
Can I compare more than one metric at a time? | Yes. Column To Compare accepts a comma-separated list of metrics, and each one appears as its own row (Label) in the output, all compared across the same set of periods. |
Why don't all periods between my Start Date and End Date appear as columns? | Only periods that contain at least one qualifying transaction appear as columns. Periods with no closed, non-zero transactions are omitted rather than shown as empty or zero. |
What determines which companies and offices are available to filter by? | By default (Company/Office set to 'All'), the report includes every company and office the running user has data access to. Specific companies or offices can be selected to narrow the results. |
Reference Video/Screenshot
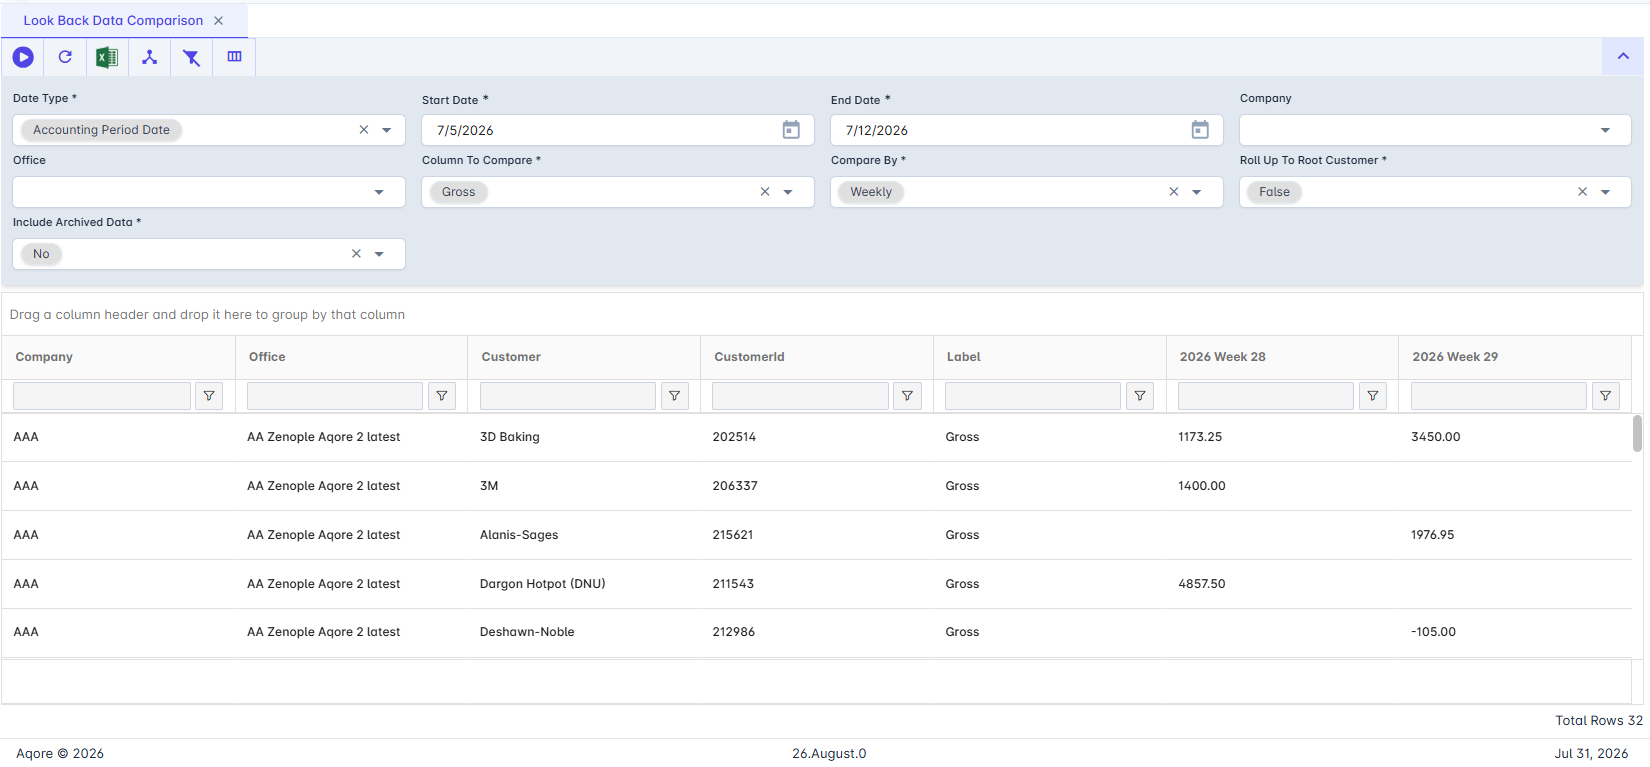
Report Details
Category | Value |
|---|---|
Parent Category | Back Office |
Category | Accounting/GL |
Report Type | Spreadsheet Report |
Report runs from Application | RMS |
Report Category: | Shareable |
Report Level | Customer |
Report Parameters
Report Parameter | Description | Parameter Options | Default | Required |
|---|---|---|---|---|
Date Type | Filters and groups record by the type of date selected. | Accounting Period Date / Pay Period End Date | Yes | |
Start Date | Includes records on or after this date, based on the Date Type selected. | Yes | ||
End Date | Includes records on or before this date, based on the Date Type selected. | Yes | ||
Company | Filters results to the selected company or companies. | List of companies the user has access to | All | No |
Office | Filters results to the office(s) belonging to the selected company. | List of offices the user has access to | All | No |
Column To Compare | Selects which metric(s) are compared across periods; accepts a comma-separated list. | Gross, GrossProfit, PayrollCost, Sales, TotalBill, TotalBillHours, TotalPay, TotalPayHours, WCCost, WCWage, ERTaxes | Gross | Yes |
Compare By | Sets the time interval used to pivot periods into columns. | Yearly / Quarterly / Monthly / Weekly | Yearly | Yes |
Roll Up to Root Customer | When True, combines child customers under their parent (root) customer. | True / False | False | Yes |
Include Archived Data | Includes archived historical records in addition to live records. | Dropdown (Yes, No) | No | Yes |
Report Grouping
The report is by default grouped according to customer.
Report Columns
Report Column | Description | Definition/Logic |
|---|---|---|
Company | Company the transaction belongs to | The tenant organization's alias, based on the office tied to the transaction. |
Office | Office the transaction belongs to | The office linked to the transaction, filtered to offices the user has access to (or the selected office list). |
Customer | Customer transactions are linked to | The organization linked to the transaction; if Roll Up to Root Customer is True, this reflects the parent/root customer instead of the individual child customer. |
Customer Id | Unique identifier for the customer | The Organization Id of the Customer column, used to distinguish customers with similar names. |
Label | The metric being compared | The name of the metric selected in Column to Compare (e.g., Gross, Sales, Payroll Cost) that this row represents. |
[Period columns] | One column per occurring time period (e.g., "Year 2025", "2025 Quarter 1", "2025 Jan", "2025 Week 12") | For each period that contains qualifying transactions within the date range, the summed value of the selected metric for that Company/Office/Customer/Label combination. |
Additional Notes
Only transactions in closed batches (Close Date is not null) with a non-zero Total Pay or Total Bill are included.
Company and Office lists default to everything the running user has data access to, based on their assigned offices.
The set of period columns is generated dynamically from the transactions found in the date range, so different runs of the report can produce a different number of columns.
Selecting a wide date range together with a fine-grained Compare By value (e.g., Weekly) can produce a very wide report with many period columns.