Overview
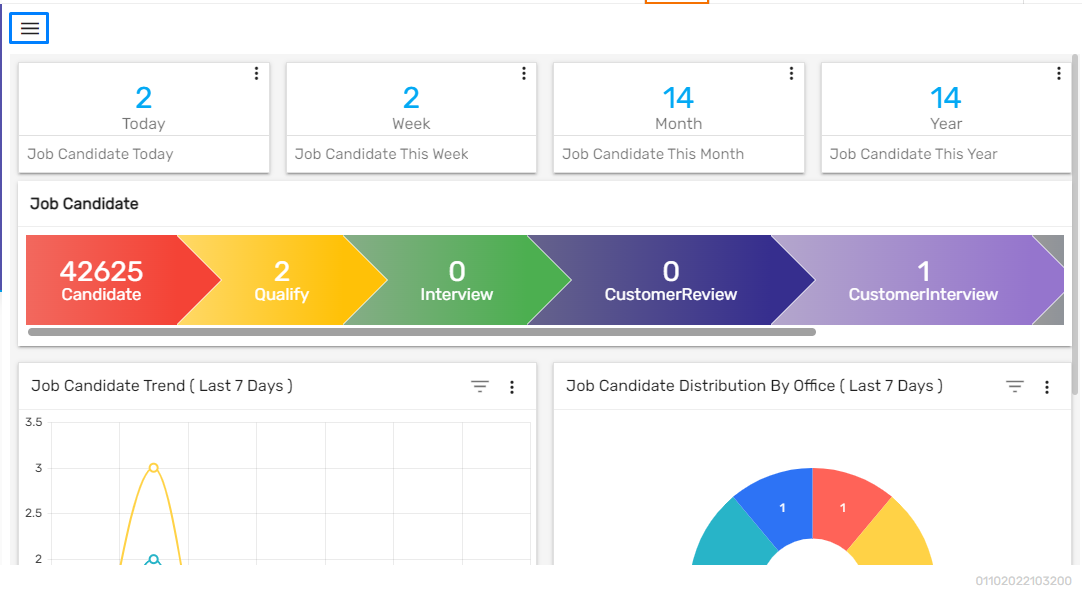
The first landing page of the Job Candidate Management (JCM) is the ‘Dashboard.’ The dashboard consists of various tiles, workflow, trend lines, donut chart, and dashboard filter.
Tiles
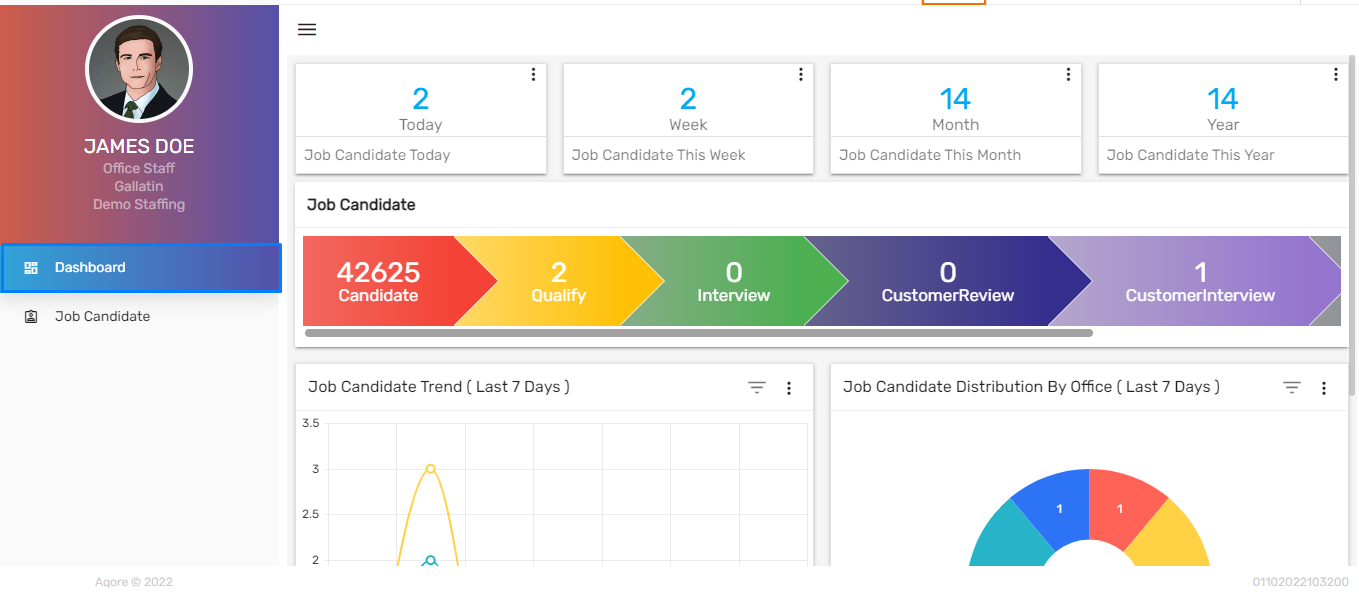
Tiles are the numeric representation of information. There are various tiles on the top of the screen. Users can view the number of candidates added 'Today,' 'This Week,' 'This Month,' and 'This Year.' Tiles are customizable and can be added upon the user’s request. Users can click on the vertical ellipsis, select other options and view the records accordingly.


Workflow
There are two workflows in JCM. They are:
- DHM Job Candidate
- Job Candidate
1. DHM Job Candidate
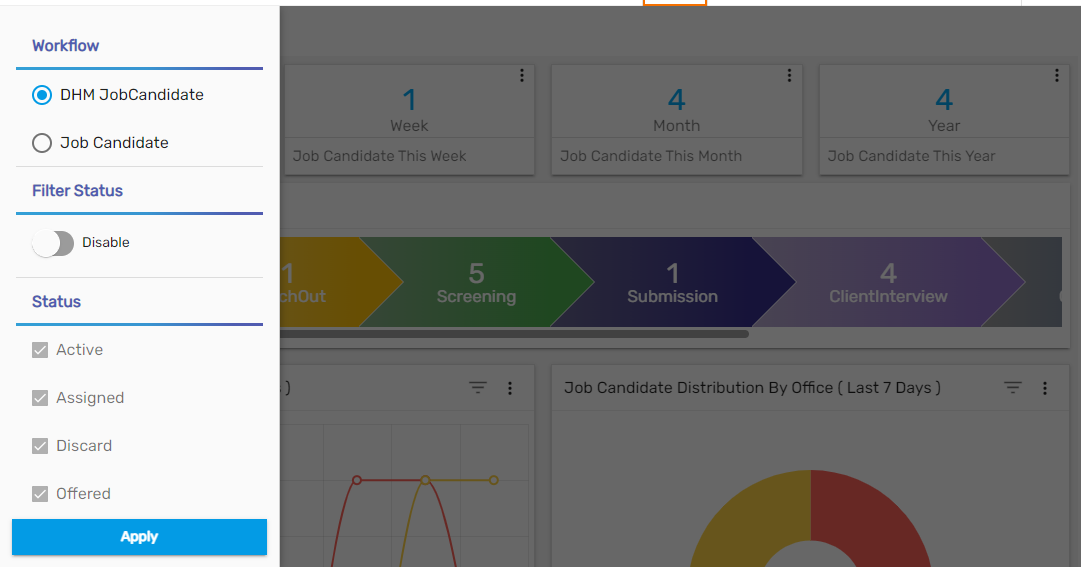
When users select 'DHM Job Candidate,' it will display the workflow of the DHM application as below:
- Candidate
- Reach Out
- Screening
- Submission
- Client Interview
- Offered
- Placement
- Total
The candidates added from Talent top navigation from Direct Hire Detail page of DHM application will be displayed in the directory of JCM when chosen DHM Job Candidate workflow.
2. Job Candidate
When users select 'Job Candidate' it will display the workflow of Temp Job Candidates as below:
- Candidate
- Qualify
- Interview
- Customer Review
- Customer Interview
- Placed
- Total
1. Candidate
This is the first stage of the Candidate workflow where new candidates are created.
2. Qualify
When the new candidate meets all the requirements the new candidates are moved to this stage.
3. Interview
In this stage of the workflow, the candidates are interviewed as per requirements.
4. Customer Review
In this stage of the workflow, the customer under which candidates are meant to be working reviews the job candidate.
5. Customer Interview
In this stage of the workflow, the job candidates are interviewed by the customer after reviewing.
6. Placed
This is the last stage of the workflow where the job candidates are finally placed for a job.
Trend Lines
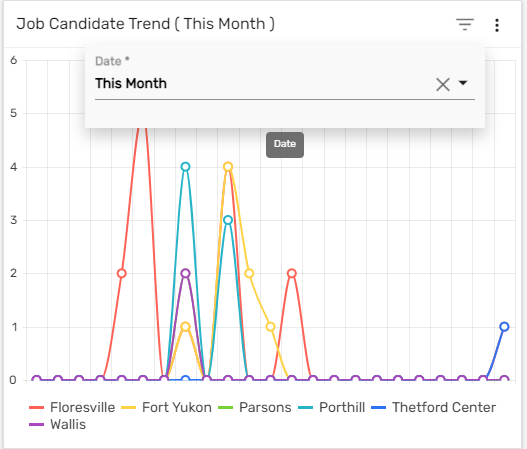
Trend Lines display the Job Candidate trend as per the selected office on the selected date. By default, the trend line is displayed based on the ‘Last 7 Days’ filter. Users can filter the Job Candidate Trend chart by 'Last 7 Days,' 'This Week,' 'Last Week,' 'This month,' 'Last 30 Days,' etc.
Donut Chart
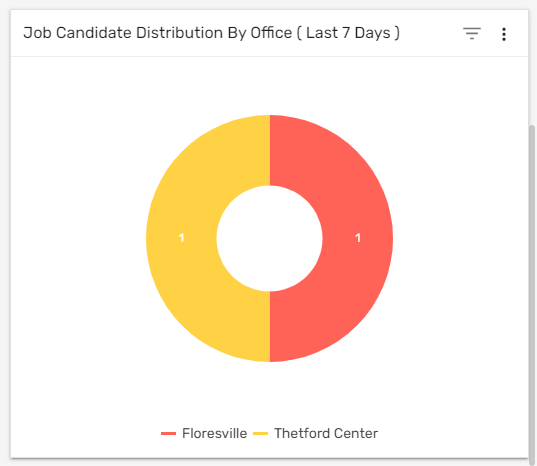
This represents the total distribution of Job Candidates by the Office which is convenient for comparing the records and drawing valuable conclusions quickly. By default, the donut chart is displayed based on the 'Last 7 Days’ filter. Users can filter the donut chart by date like 'Last 7 Days,' 'This Week,' 'Last Week,' 'This Month,' 'Last 30 Days,' etc.
Filter
Filter option allows users to select the Workflow and view the directory page based on it. Users can also enable the Filter Status and then choose various status/es and user role/s as required to view the candidates based on the Filter Status and User Role.
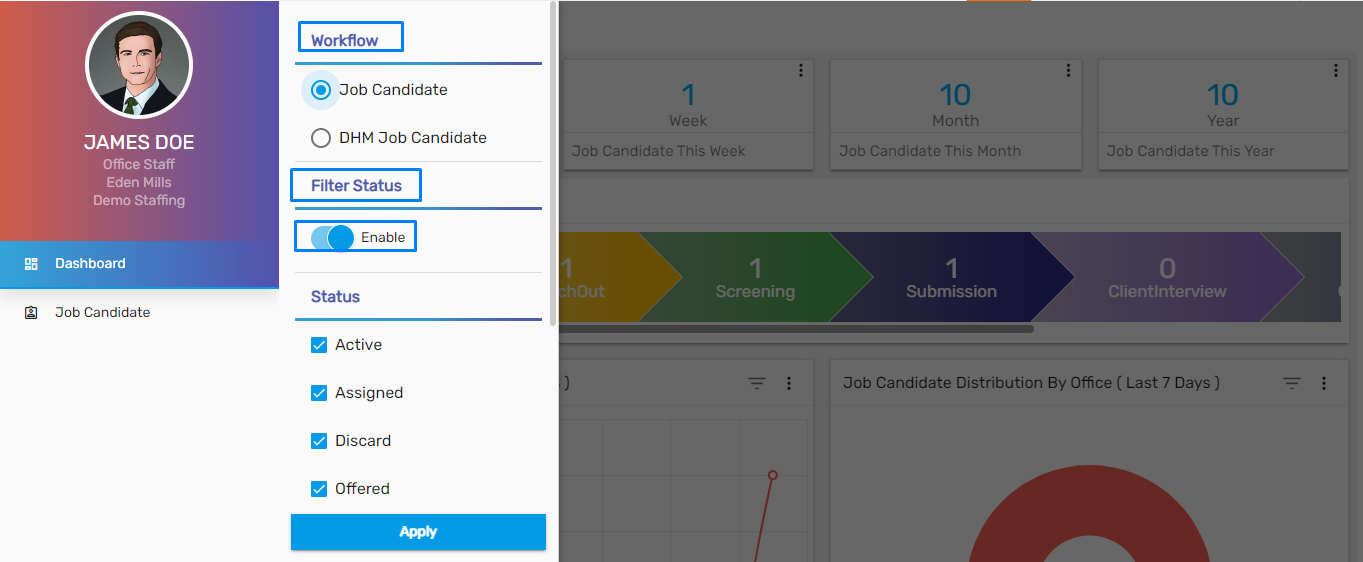
Users can use the Filter from the hamburger icon.
