Summary
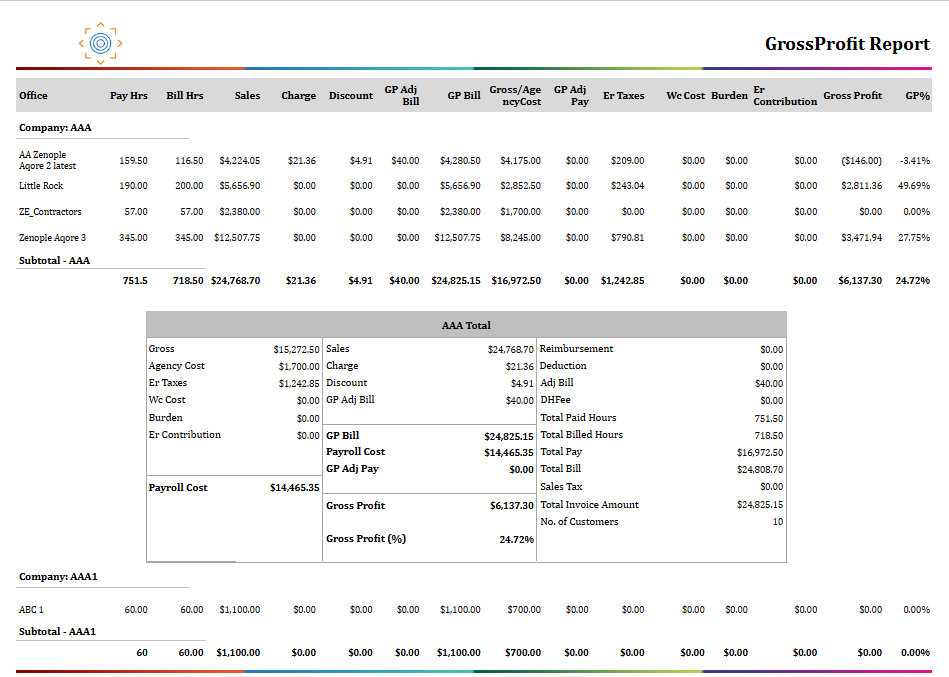
The Gross Profit Report shows how much revenue was earned and how much payroll-related cost was incurred over a selected date range, then calculates profit and profit percentage. It is designed to help staffing operations monitor margin performance across companies and offices.
This report combines current and archived finalized payroll activity, so teams can review profitability over both recent and historical periods in one place.
This report is essential for:
Finance teams: monitor revenue, costs, and profitability trends.
Payroll managers: compare billed amounts against payroll-related expense.
Operations leaders: evaluate office-level and company-level performance.
Branch or office managers: identify low-margin locations that need action.
The key business outcome is faster, more consistent margin analysis for operational and financial decision-making.
Report Overview
Attribute | Details |
Purpose | Provides company-level and office-level gross profit metrics for a selected date range. |
Classification | Financial Report |
Who Should Use This Report | Finance teams, Payroll managers, Operations leaders, Office managers |
Business Problem Solved | Gives one view of sales, payroll cost, and gross profit so teams can quickly identify margin performance issues |
Run Frequency | Weekly, monthly, and on-demand |
Related Reports | Gross Profit Detail, Gross Profit By Customer, Gross Profit Summary |
Business Value
Category | Description |
Margin Visibility | Shows gross profit and gross profit percentage in one report so performance is easy to evaluate. |
Office Comparison | Breaks data down by office so managers can compare branches and spot underperforming locations. |
Financial Control | Separates revenue and key cost components, helping teams understand what is driving margin change. |
Historical Analysis | Includes archived finalized payroll activity for longer-period trend review. |
Decision Support | Helps leadership prioritize pricing, cost control, and operational improvements based on real report output. |
Known Issues or Limitations
Issues | Description |
Access-based visibility | Users only see companies and offices they have permission to view. |
Date interpretation | The report uses pay-period-based timing for filtering, which may differ from other date perspectives used in operational workflows. |
Finalized data only | Unfinalized payroll activity is excluded, so in-progress periods may appear lower until finalization. |
Zero-activity exclusion | Rows with no billed amount and no payroll amount are not shown. |
Troubleshooting Guide
Issues | Problem Reason | Solution |
No data appears | Selected dates have no finalized payroll/billing activity, or selected filters have no matching records. | Expand the date range and confirm the company and office filters are correct. |
Office expected but missing | The office has no qualifying transactions for the selected period, or the user does not have access to that office. | Confirm user access and run again with a broader office selection. |
Profit percentage looks unusual | Revenue or cost values are very low for the period, which can make percentages swing sharply. | Review the detailed amounts (sales, adjustments, discount, payroll cost) for that office and period. |
Totals do not match another report | Reports may use different timing rules or include different transaction states. | Confirm both reports use the same date range and finalized-data scope before comparing. |
FAQ
Questions | Answers |
Does this report include historical archived transactions? | Yes. It includes both current and archived finalized payroll activity. |
Can I run it for specific companies or offices? | Yes. You can filter by company and related office. |
Why are some offices not listed? | Offices appear only when they have qualifying activity in the selected period and are within your access scope. |
What does Gross Profit % represent? | It is the gross profit compared to gross-profit billable revenue for the selected period. |
Does this report include unfinalized payroll? | No. It is based on finalized payroll/billing activity. |
Reference Video/Screenshot
Report Details
Category | Value |
Parent Category | Back Office |
Category | Gross Profit / Transaction |
Report Type | Paginated Report |
Report runs from Application | RMS |
Report Category | Shareable |
Report Level | Transaction |
Report Parameters
Report Parameter | Description | Parameter Options | Default | Required |
Start Date (AP) | Beginning accounting period date for report calculation | Yes | ||
End Date (AP) | Ending accounting period date for report calculation | Yes | ||
Company | Filter records by companies selected | List of companies that the users have access to | No | |
Office | Filters records by offices selected | List of offices for the company selected | No |
Report Grouping
Company
The report will be grouped by the Company by default.
Report Columns
Report Column | Description | Definitions/Logic |
Alias | Short company identifier used in reporting. | Pulled from the company setup used for reporting output. |
Office | Office/branch name. | Taken from the selected office linked to the transaction activity. |
Pay Hours | Total payroll hours. | Adds all payroll hours for qualifying records in the selected period. |
Bill Hours | Total billable hours. | Adds all billed hours for qualifying records in the selected period. |
Sales | Core billed revenue amount. | Sums standard sales amounts for qualifying records. |
Charge | Additional billable charges. | Sums charge amounts applied to qualifying records. |
Discount | Reductions applied to billed revenue. | Sums discount amounts for qualifying records. |
GP Adjustment Bill | Billing-side gross profit adjustments. | Sums billing adjustments that affect gross profit billable revenue. |
GP Adjustment Pay | Pay-side gross profit adjustments. | Sums pay adjustments that affect gross profit. |
GP Bill | Gross-profit billable revenue base. | Calculated from sales, plus charges, minus discounts, plus billing adjustments. |
Gross | Gross wage-related amount. | Summed for worker records classified as employees. |
ER Taxes | Employer tax amount. | Sums employer tax expense for qualifying records. |
WC Cost | Workers' compensation cost. | Sums workers' compensation expense for qualifying records. |
Burden | Additional burden cost. | Sums burden cost values linked to payroll activity. |
ER Contribution | Employer-paid benefit contribution. | Sums employer contribution amounts included in payroll cost. |
Gross Profit | Profit amount after payroll-related costs. | Uses the report's gross profit value aggregated over qualifying records. |
Additional Notes
The report excludes records where both billed total and payroll total are zero. |
Data appears only for finalized payroll activity; open or unfinalized activity is not included. |
Company and office visibility follow user access rules. |
Company-level totals and grand totals are generated in addition to office-level detail rows. |
When GP Bill is zero, GP % is shown as 0 to avoid invalid percentage values. |