Overview
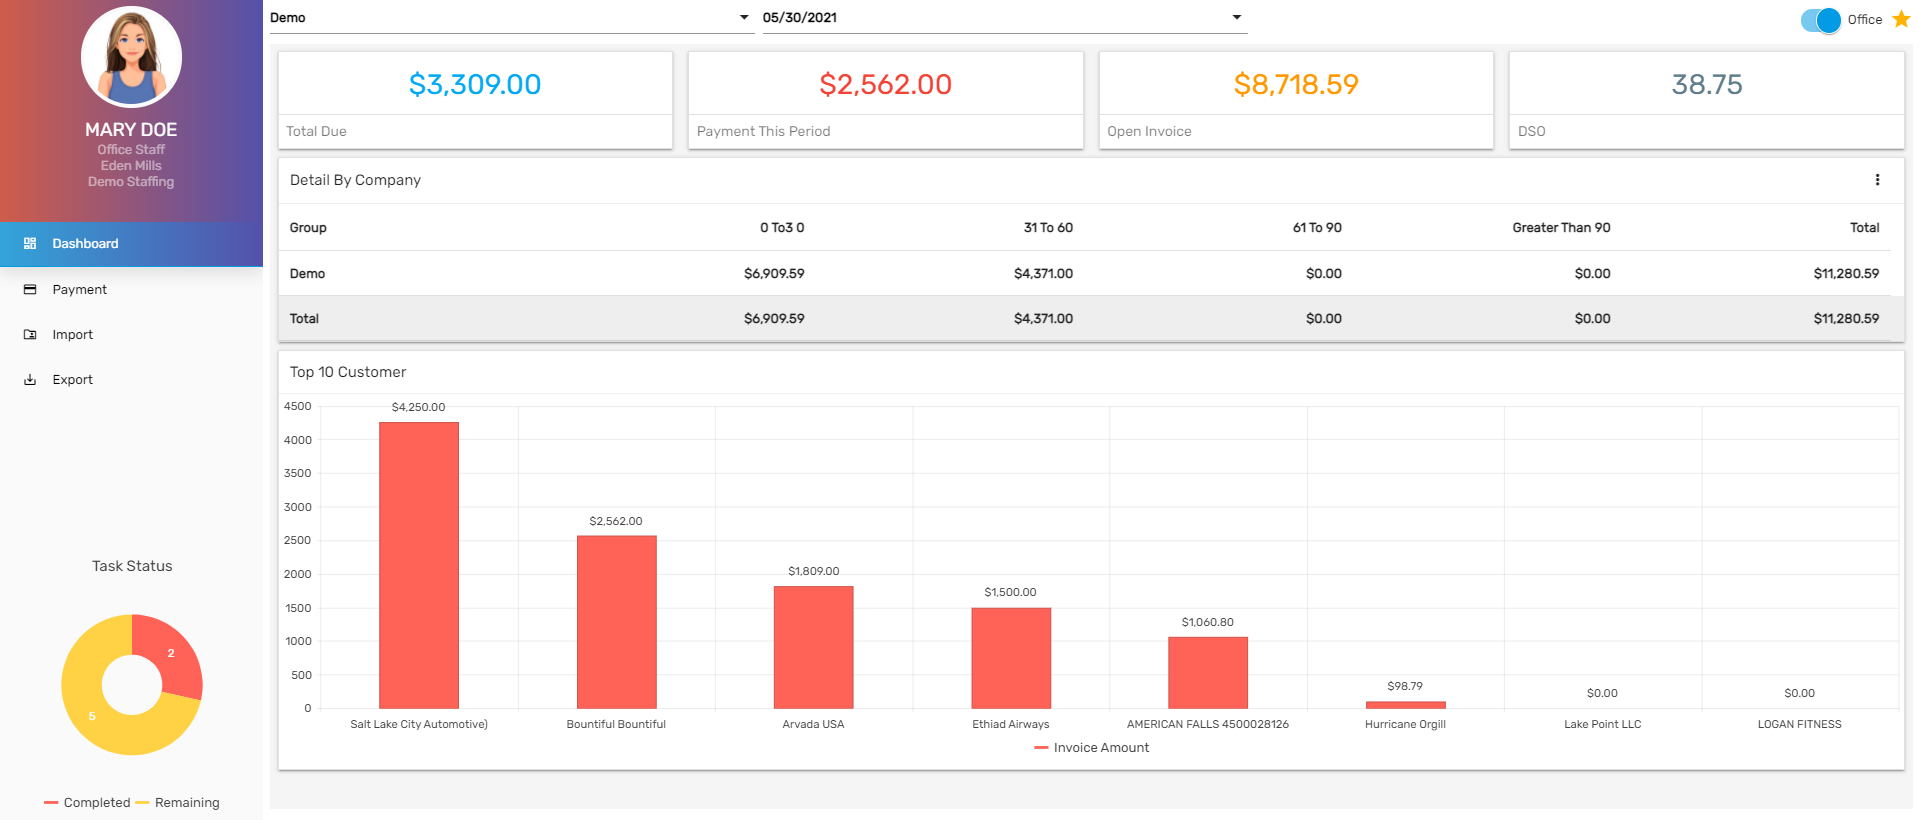
The first landing page of the ARS is the ‘Dashboard’. The dashboard consists of various tiles, detailed tabular information with filters, graphs, and task status. The records are displayed in the dashboard after users select the company and the accounting period.
Tiles
According to the selected accounting period, tiles give the numeric representation of the 'Total Due,' 'Payment This Period,' 'Open Invoice,' and DSO (Days Sales Outstanding).

Toggle Button
The toggle button shows the ‘Office’ and ‘Back Office’ records. The records are displayed based on the selected toggle button in the graph section.
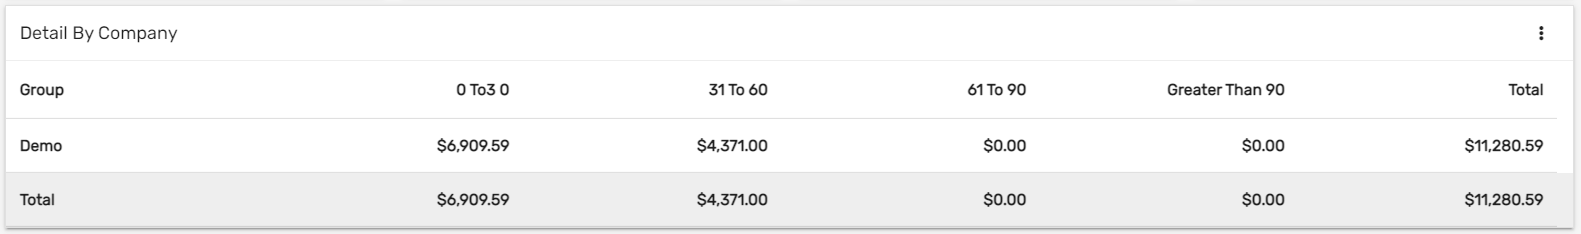
Detailed Table
This displays the tabular information of the selected company and accounting period.
Users can click on the vertical ellipsis button and view the details accordingly by ‘Company,’ ‘Office,’ and ‘Back Office.’ By default, 'Detailed by Company' is selected.
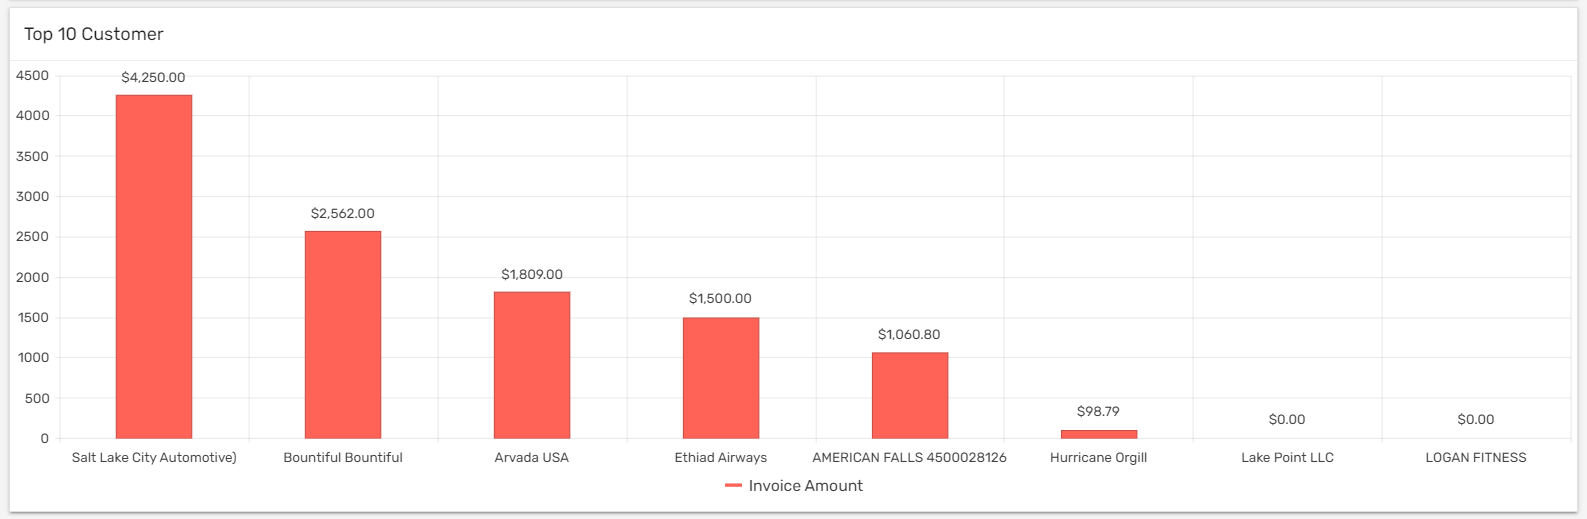
Graph
The graph displays the ‘Top 10 Customer’ with the invoice amount and office.
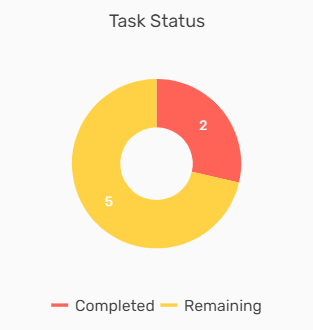
Task Status
The 'Task Status' shows the count of tasks completed and remaining. Users can view the count of tasks status in the donut chart.