Features Added on DDS
The features added on the DDS are:
Dashboard Rename
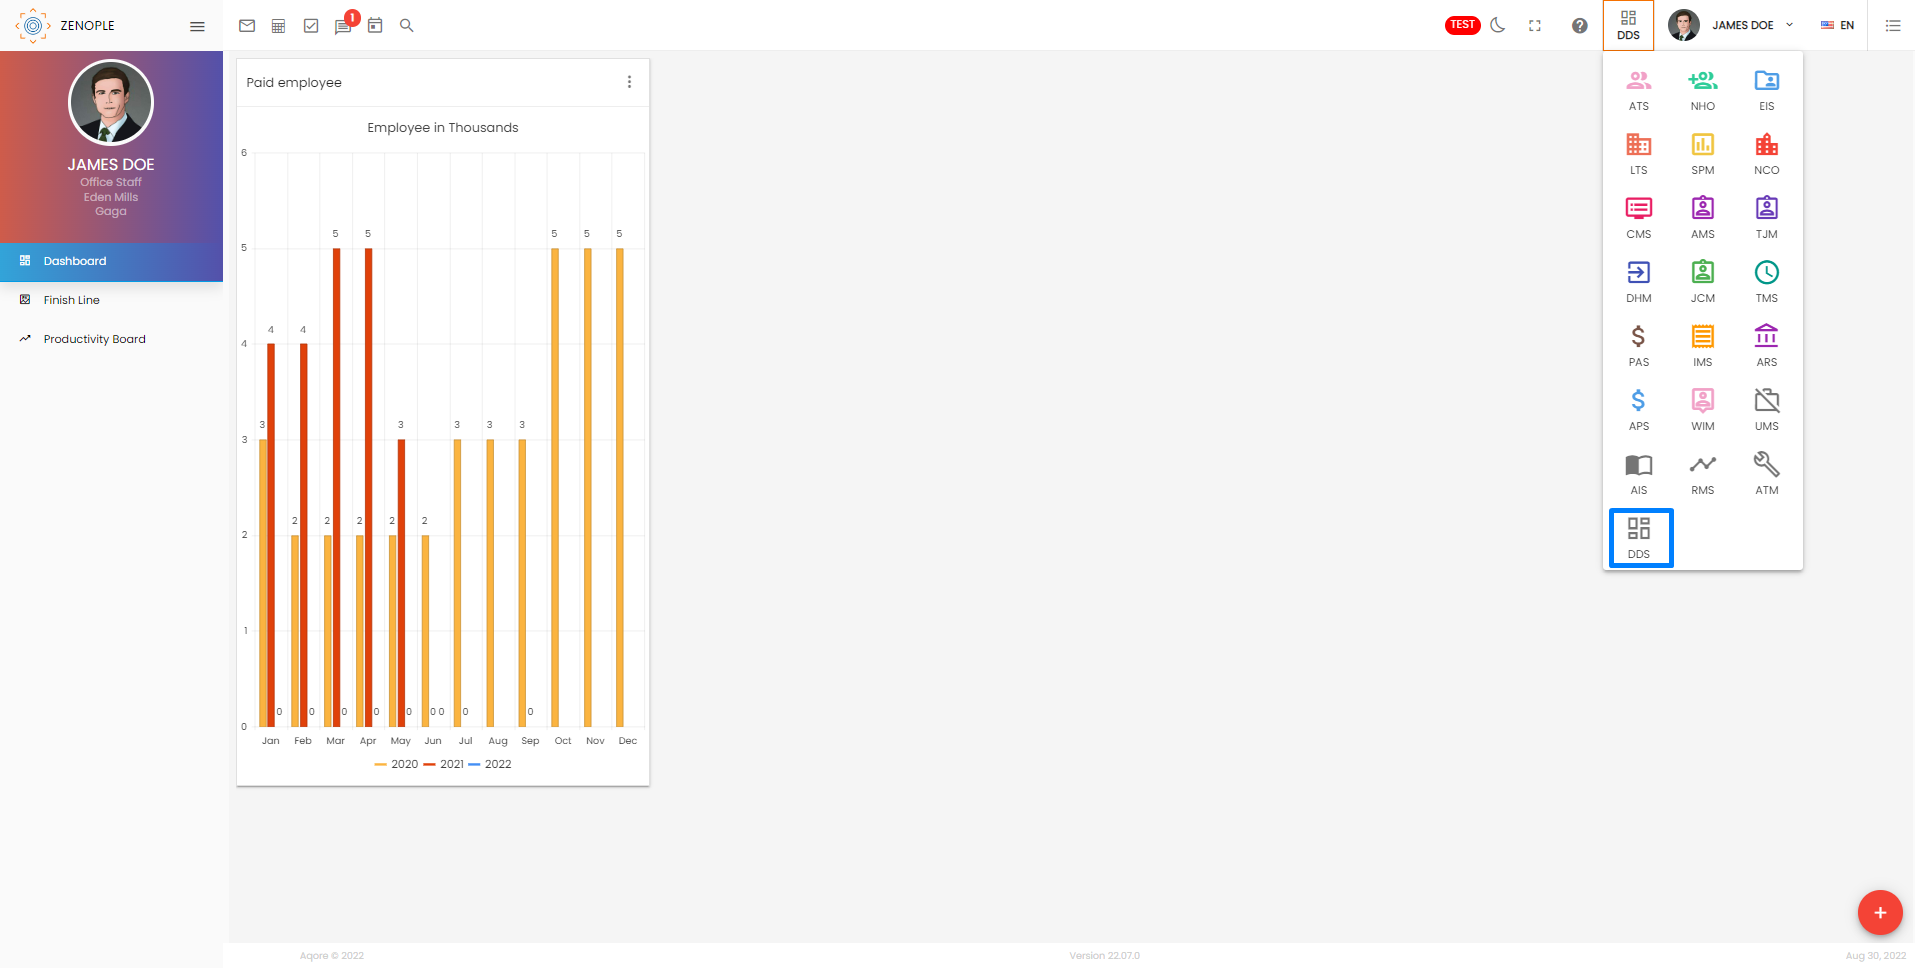
DD Dashboard has been renamed to DDS (Dynamic Dashboard System).
Productivity Board
Productivity board main navigation has been implemented in the DDS Dashboard. It allows users to create and track goals for office staff. The goals are created at a person and office level using various productivity templates and the templates include various parameters for the goal calculation.
Dashboard
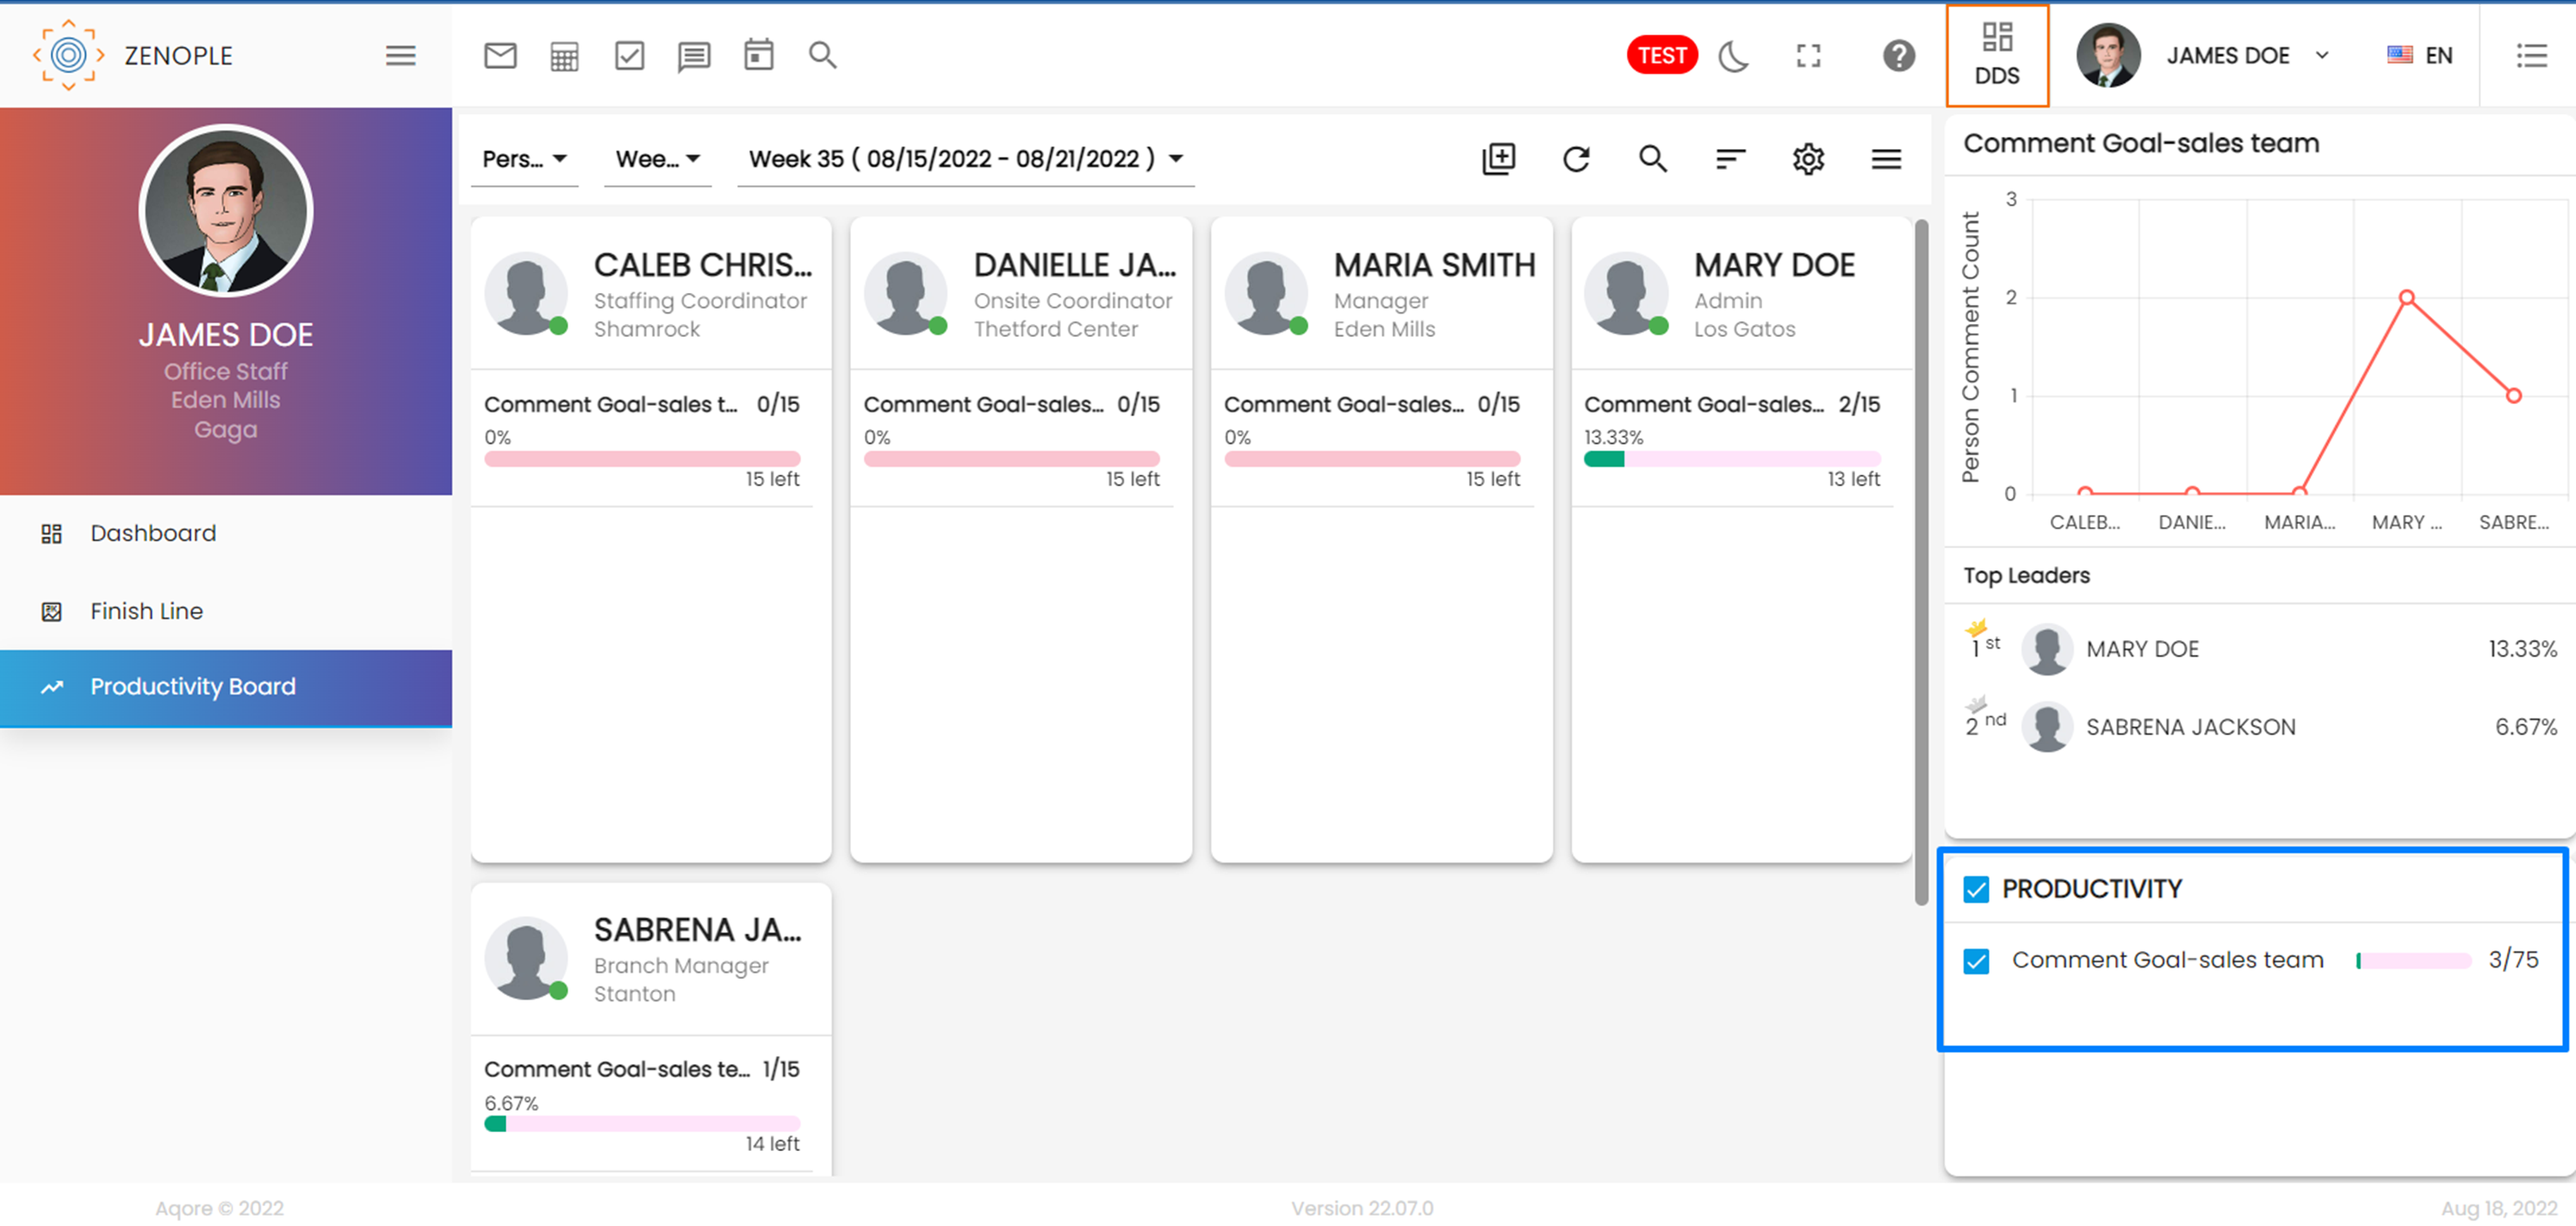
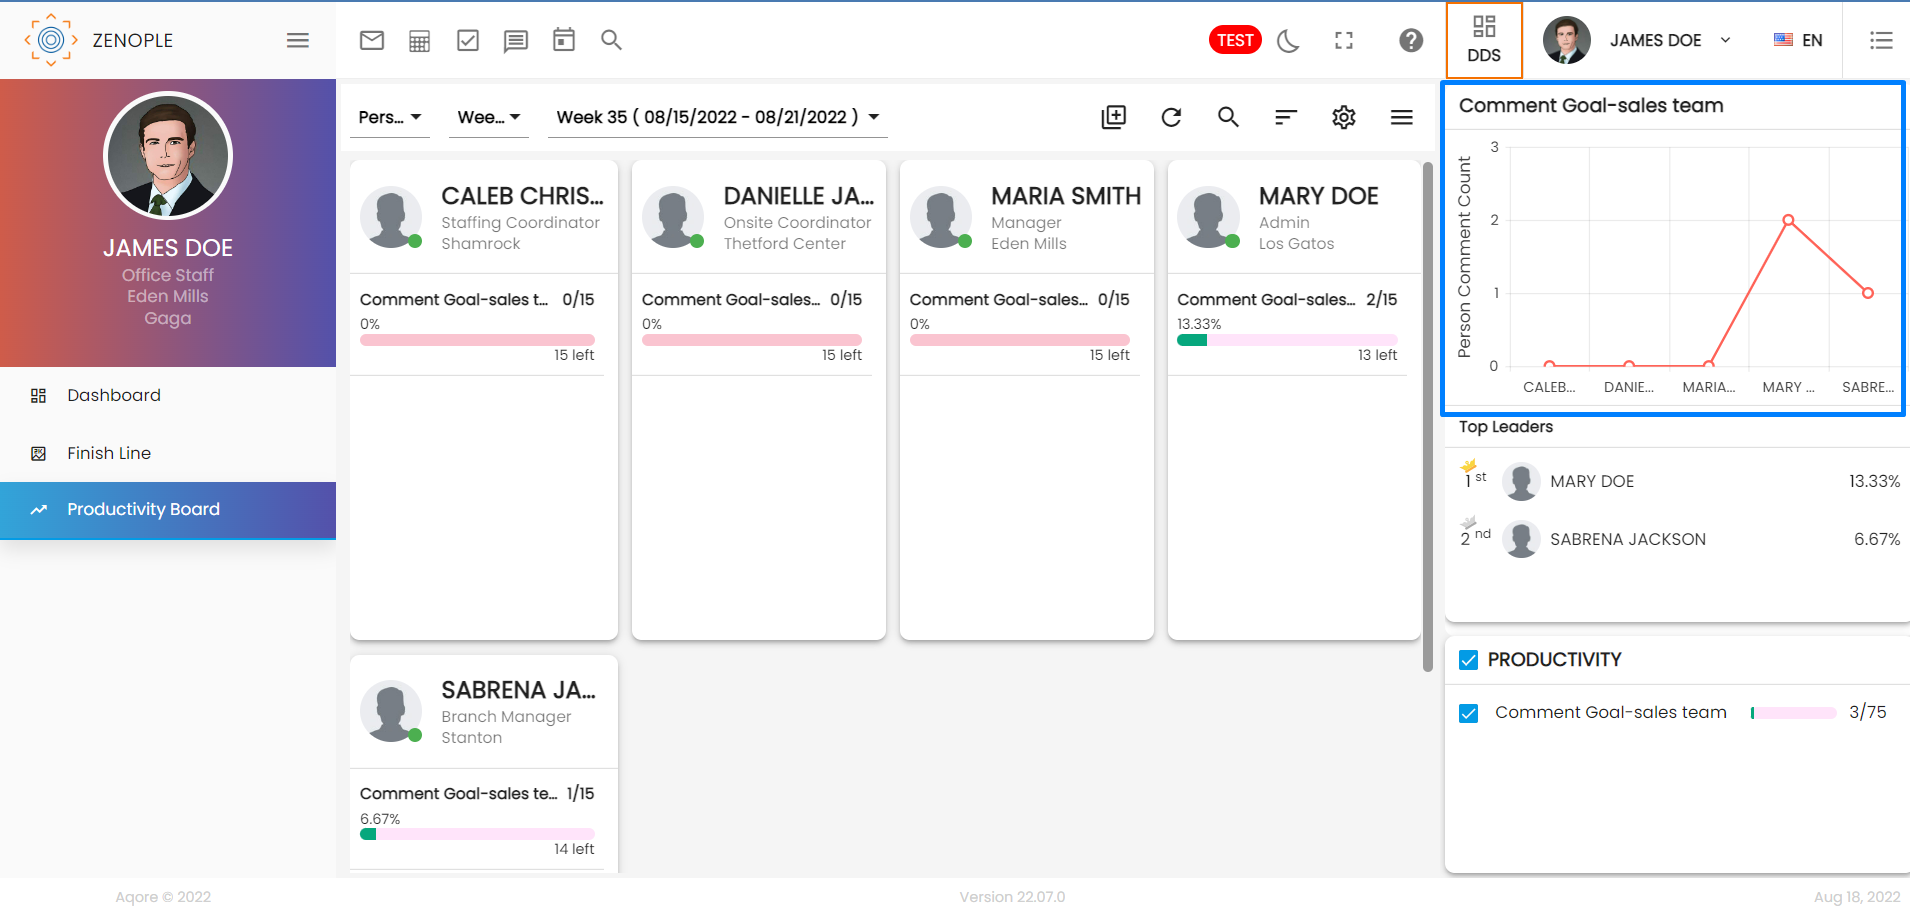
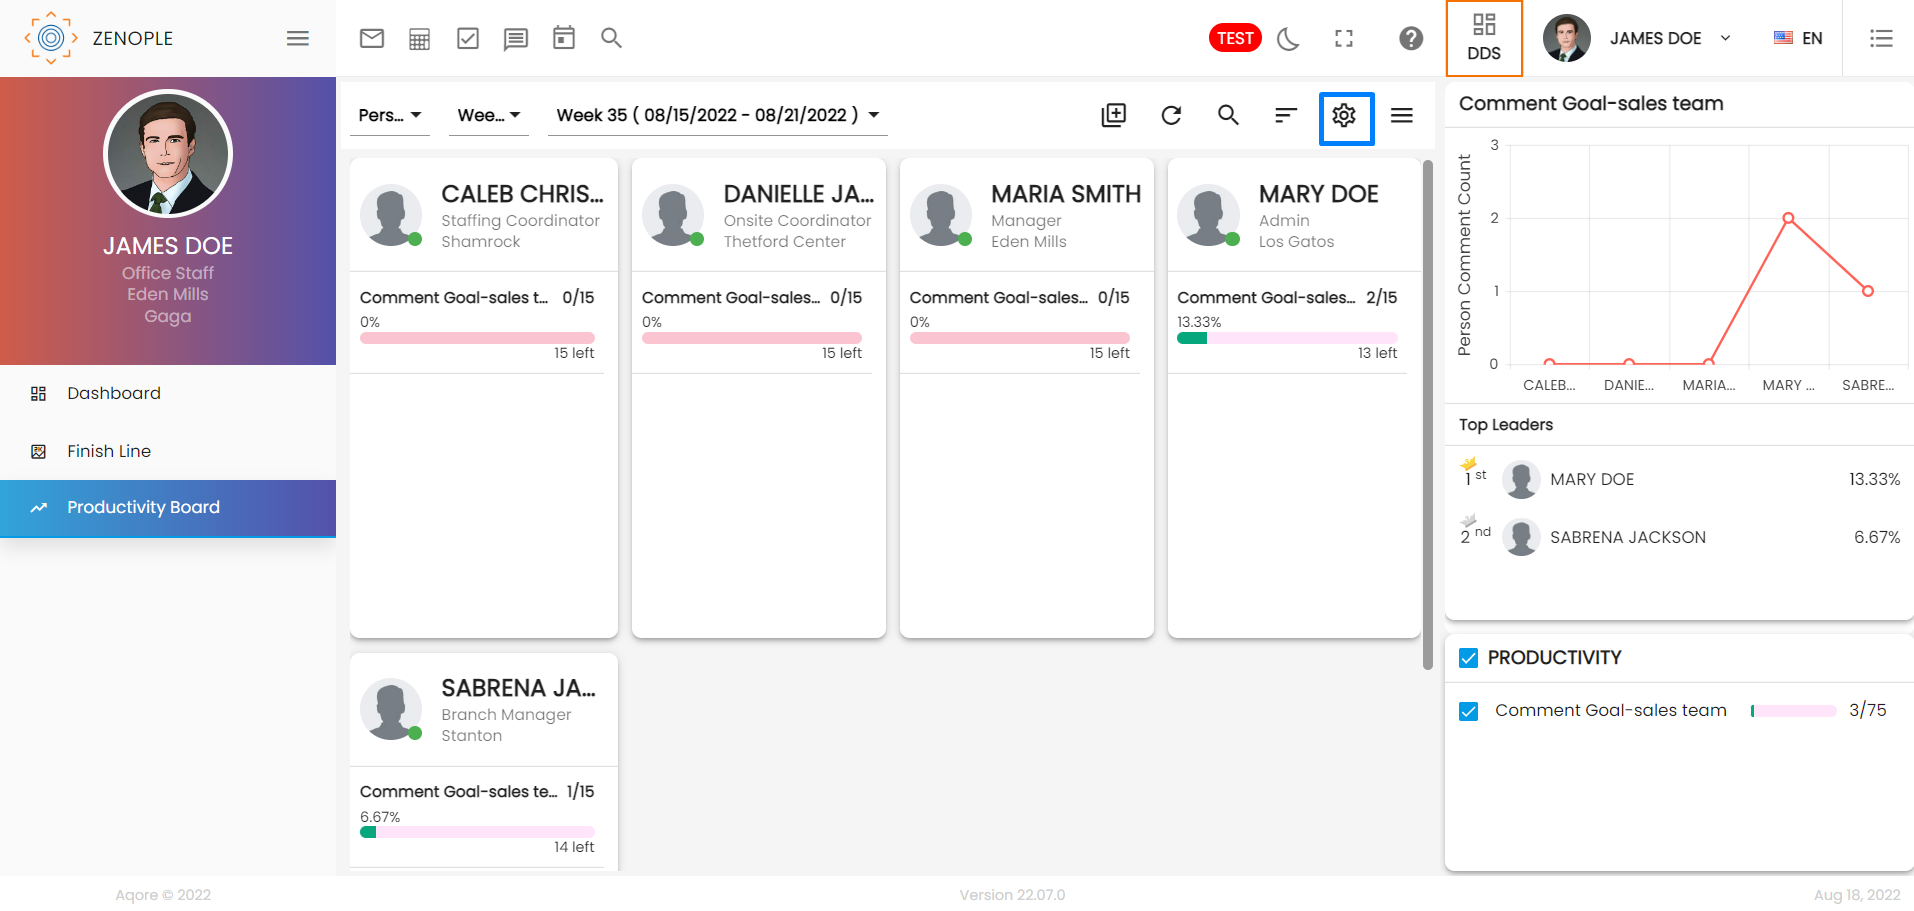
It displays individual card view details of office staff’s productivity which is assigned to them. The card includes details of the productivity template along with the progress bar for each productivity. Users can select the entity level, goal frequency, and time interval to view the goal details.
The dashboard also includes filters, bar graphs, and a “Top leaders” section for each specific productivity created under the selected options from the dropdown filters.
.png)
The Top leader's section displays the top goal achievers based on the goal count and the productivity selected.
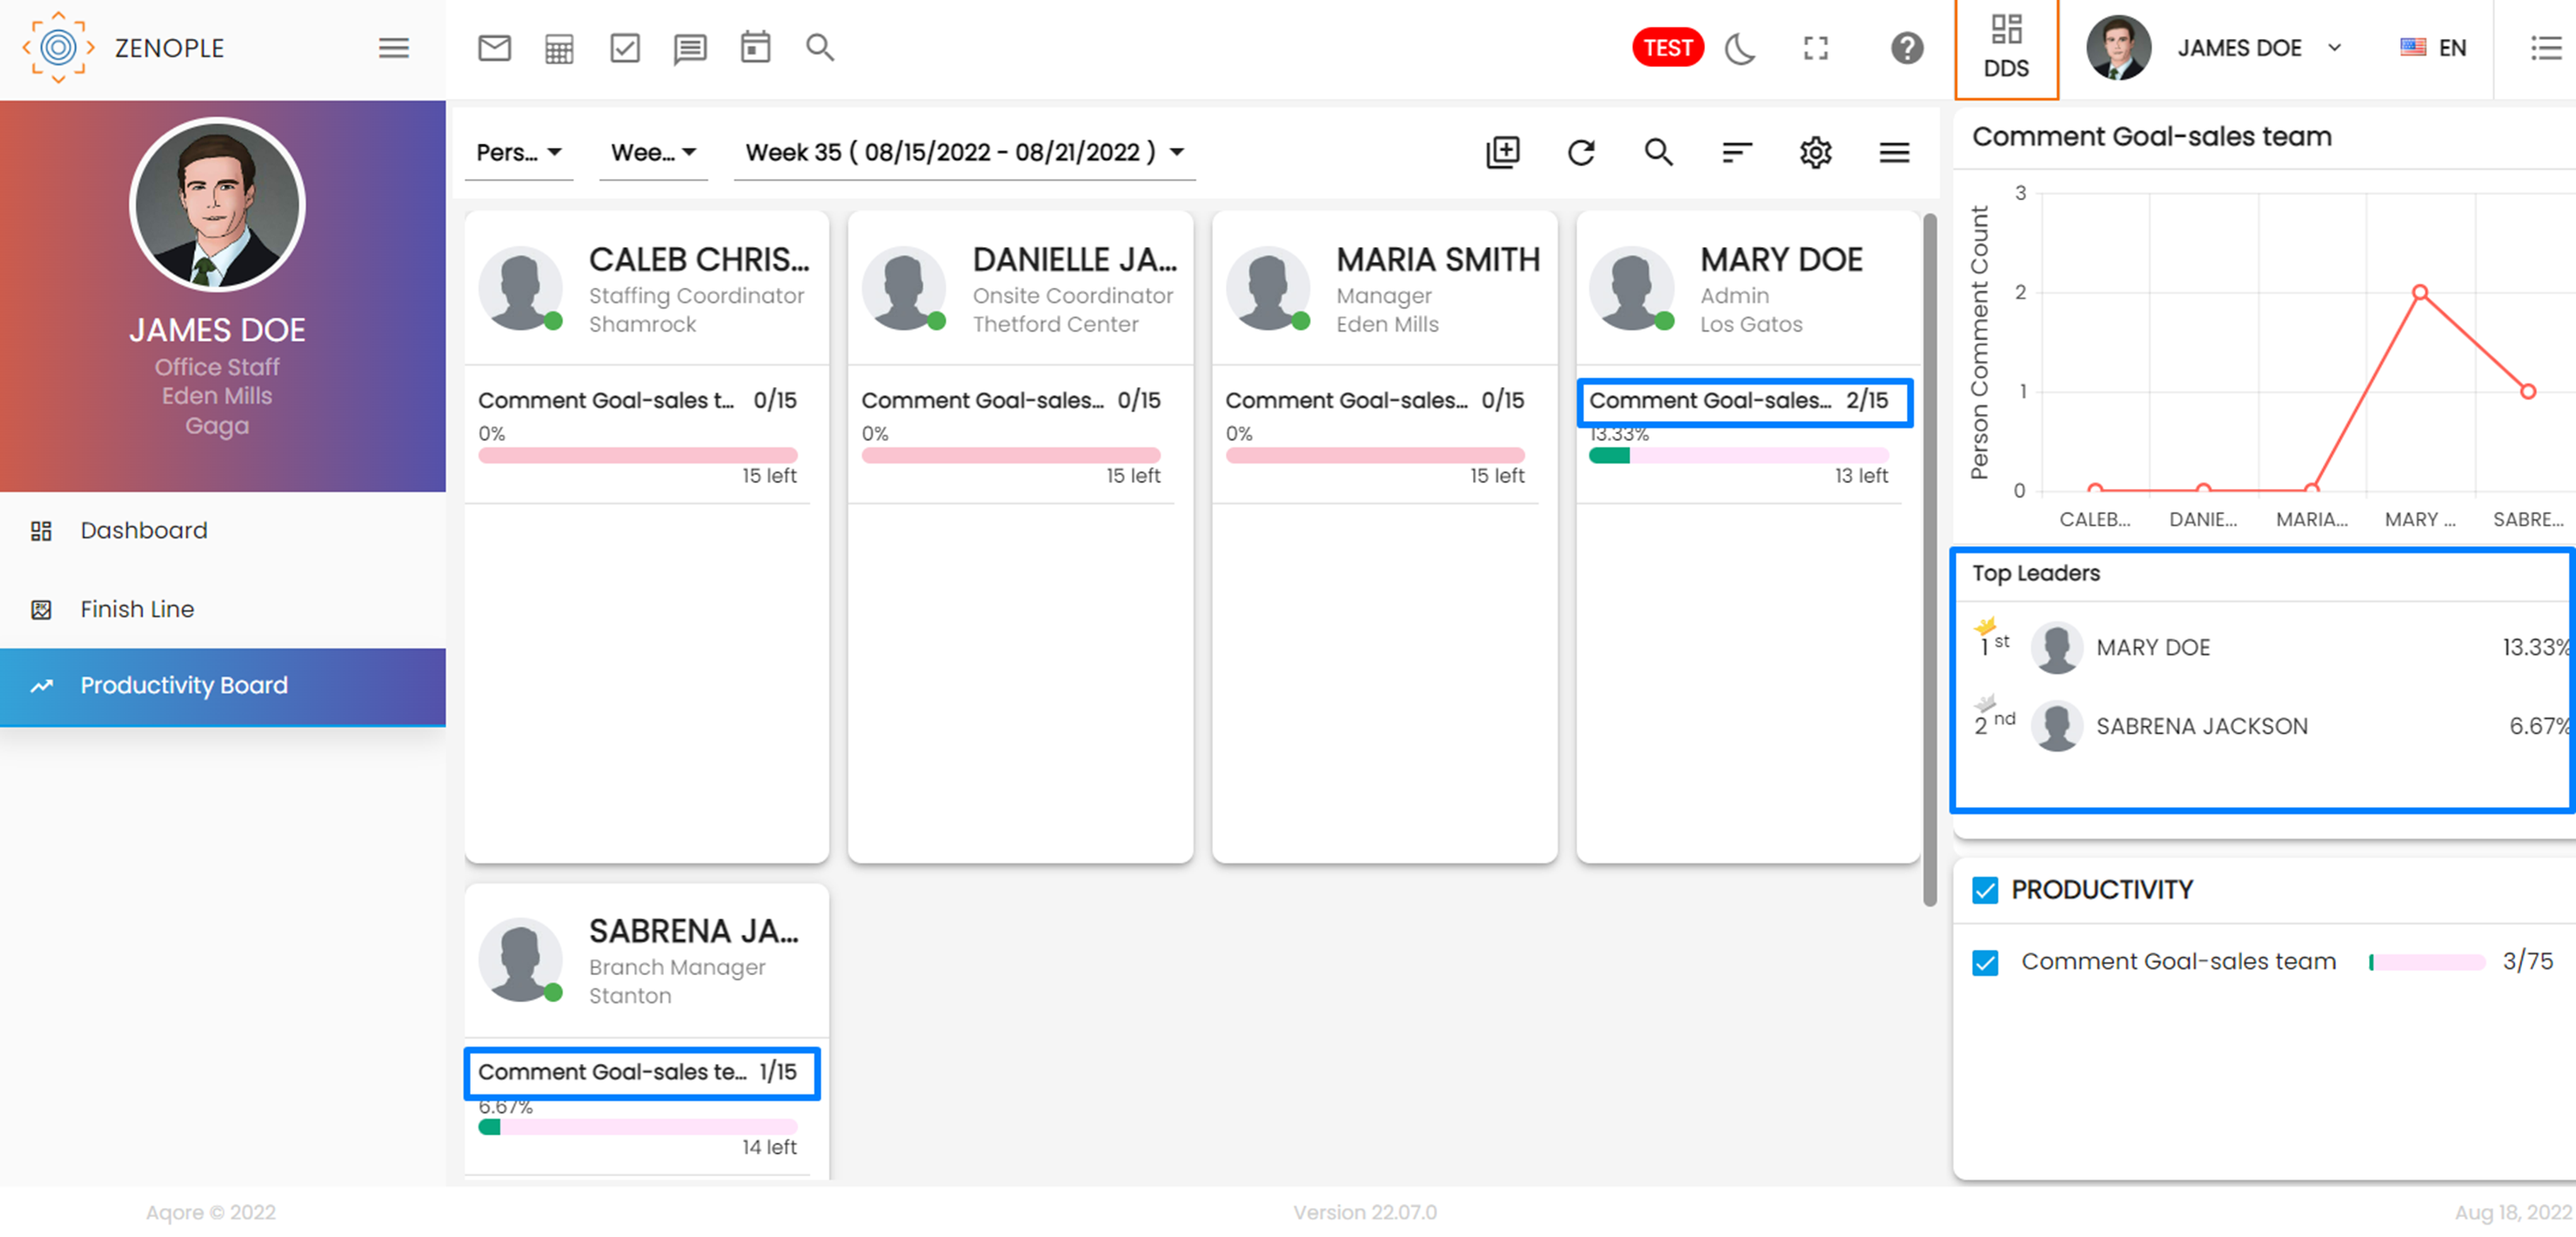
Users will be able to view the dashboard details based on the productivity filter in case multiple productivity templates are created. Based on the selection, the records on the dashboard get reflected.
The bar graph displays the goal achievement count based on templates.
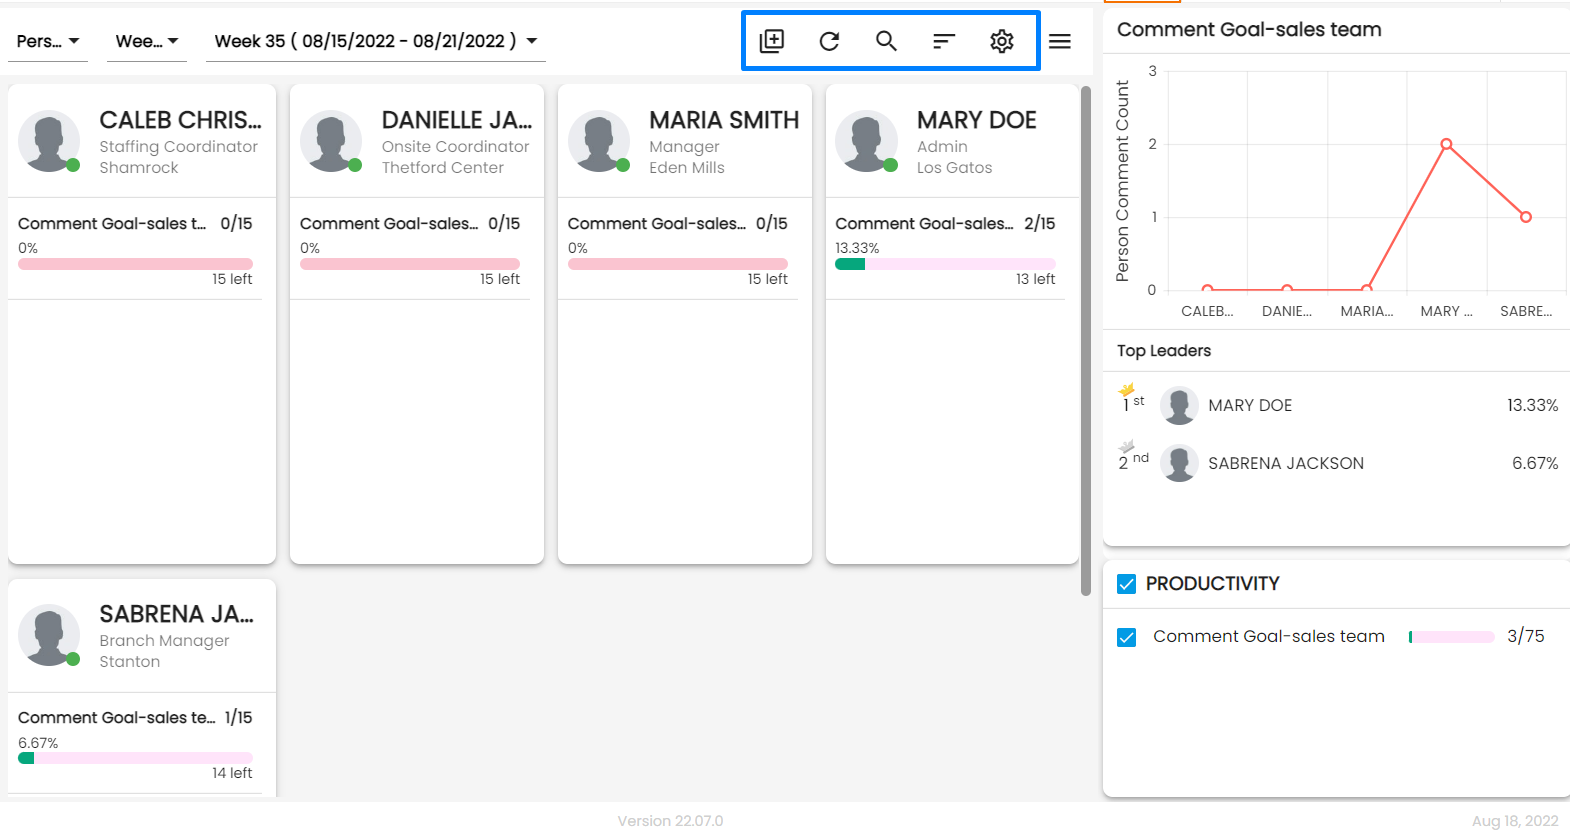
There are five actions on the productivity dashboard
- Generate goal details
- Refresh
- Search
- Sorting
- Productivity Setup
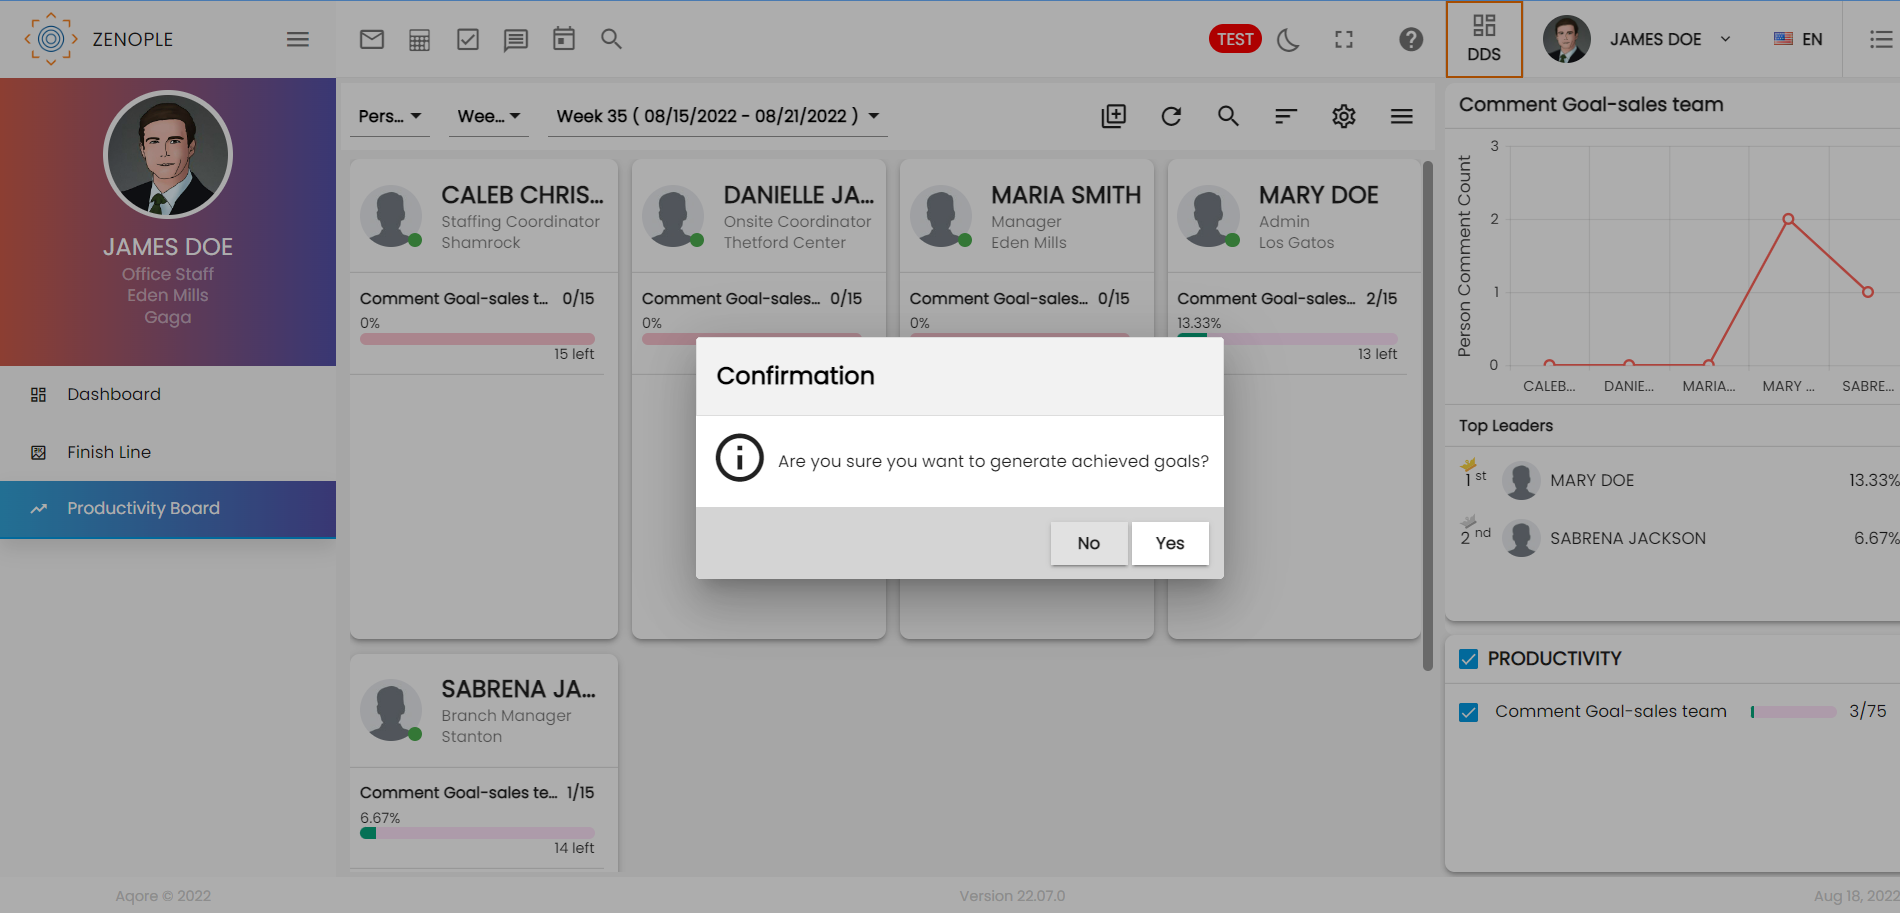
Generate Goal details
This action allows users to generate the updated goal details and reflect them in the dashboard. Although the goal details are automatically updated on daily basis, users can choose to generate and update the goal details in real time with this action.
Refresh
It allows users to refresh the details in case of any changes.
Search
It allows users to search by productivity name and entity name.
Sorting
It allows users to sort by productivity name and entity name.
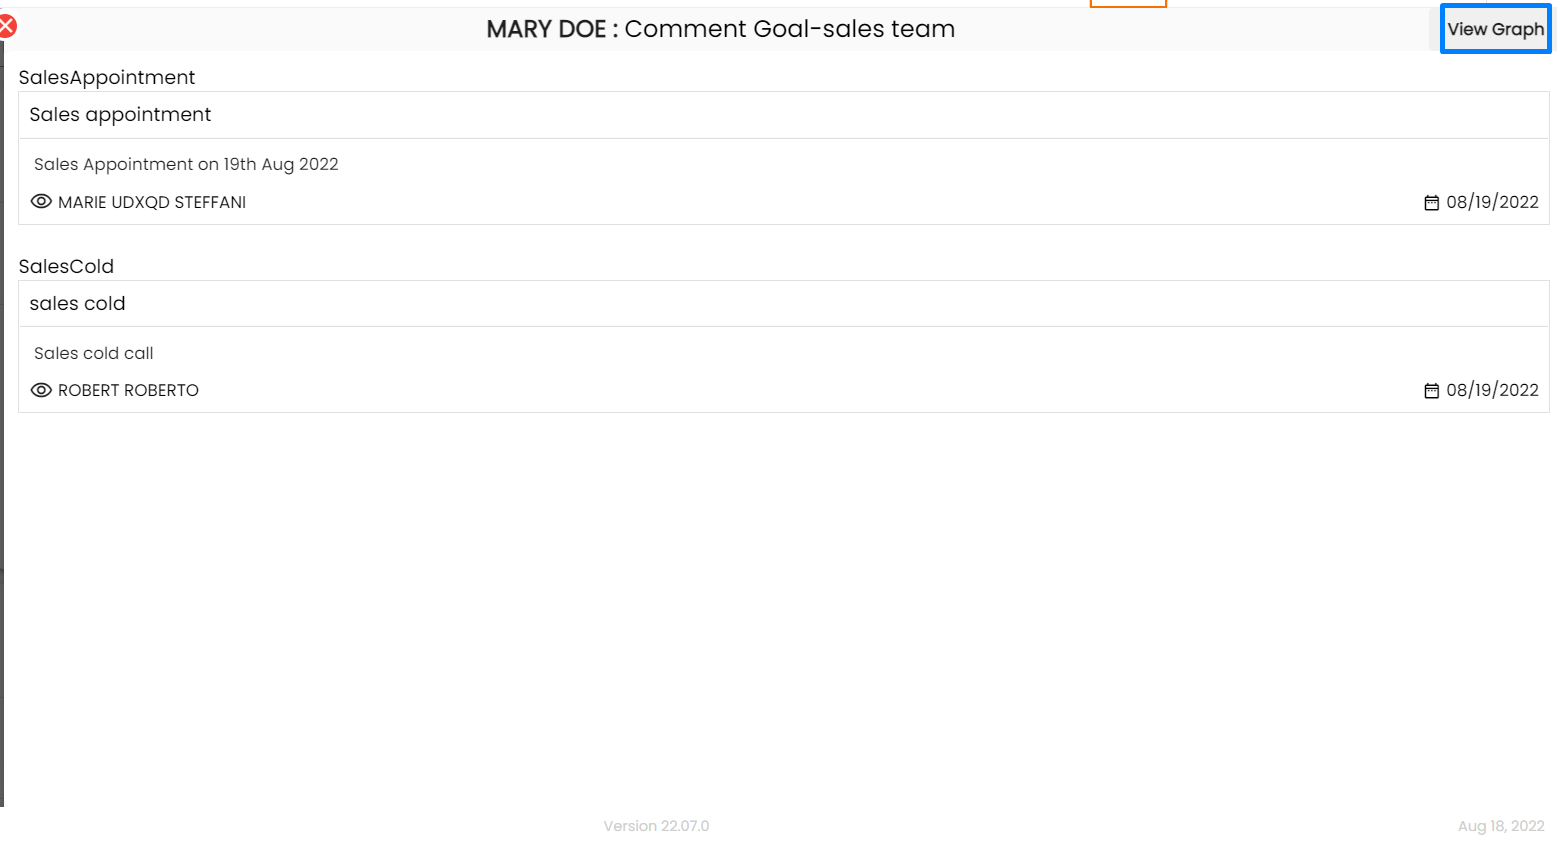
Users can click on the progress bar to view the specific details of the goal and redirect to the related detail page of the entity from the eye view icon.
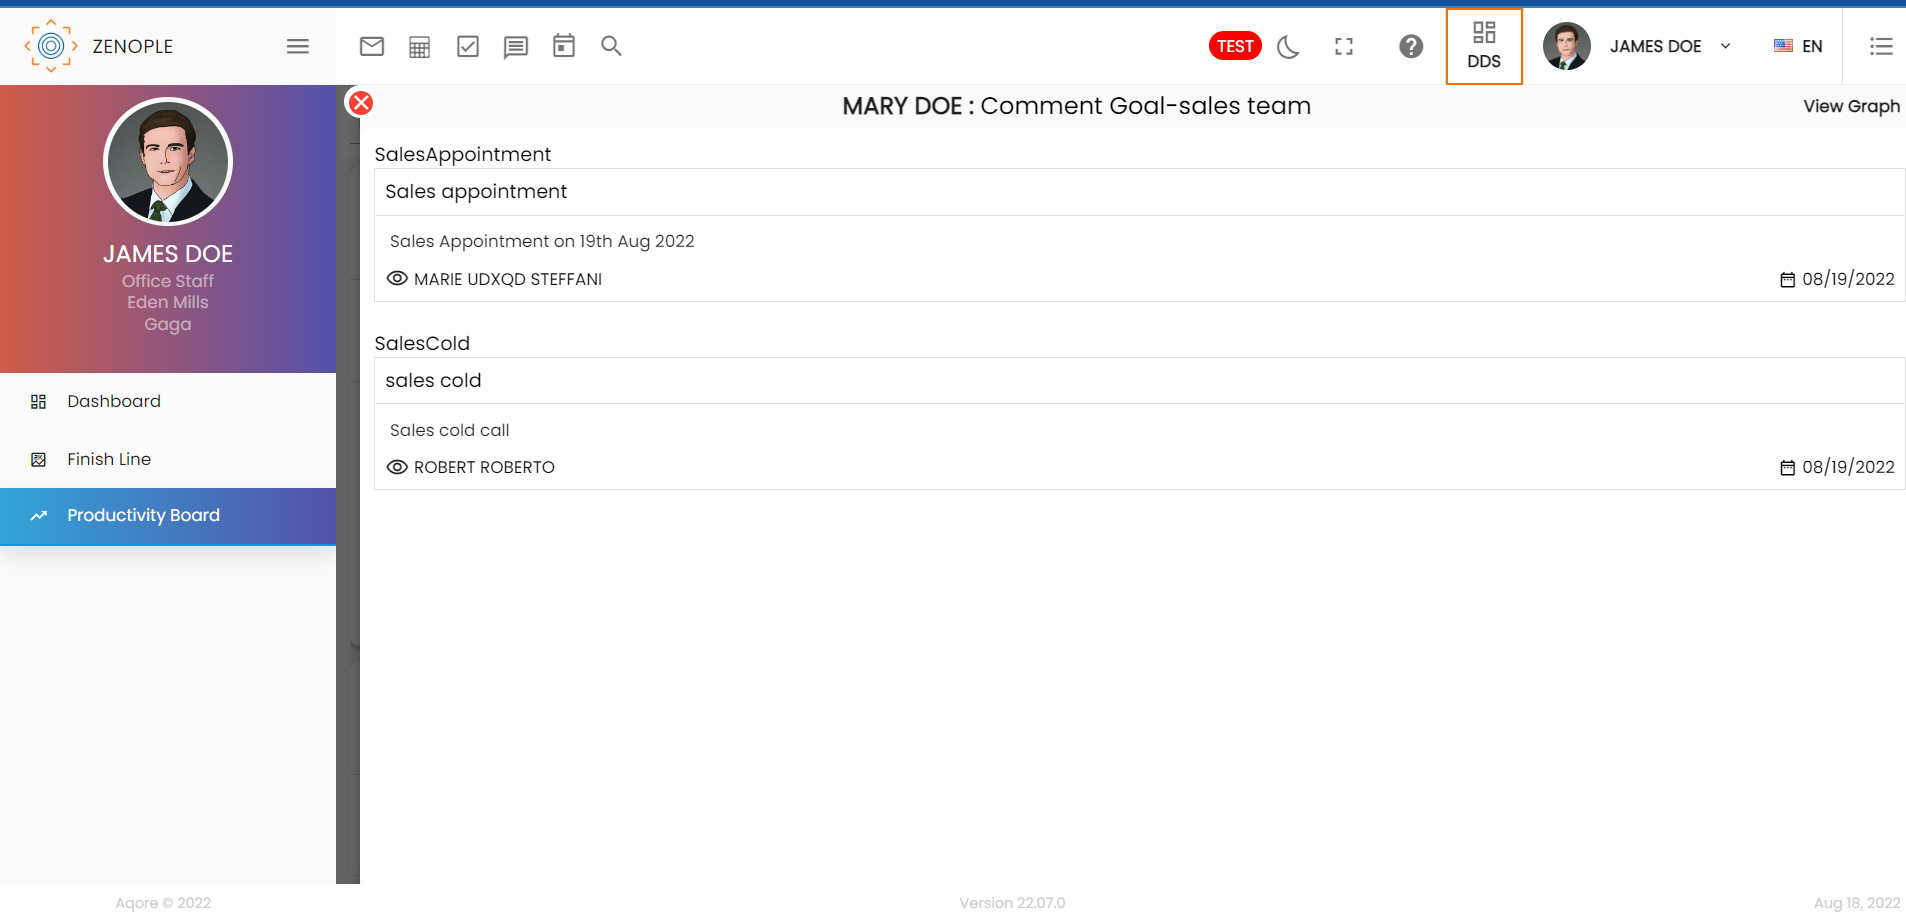
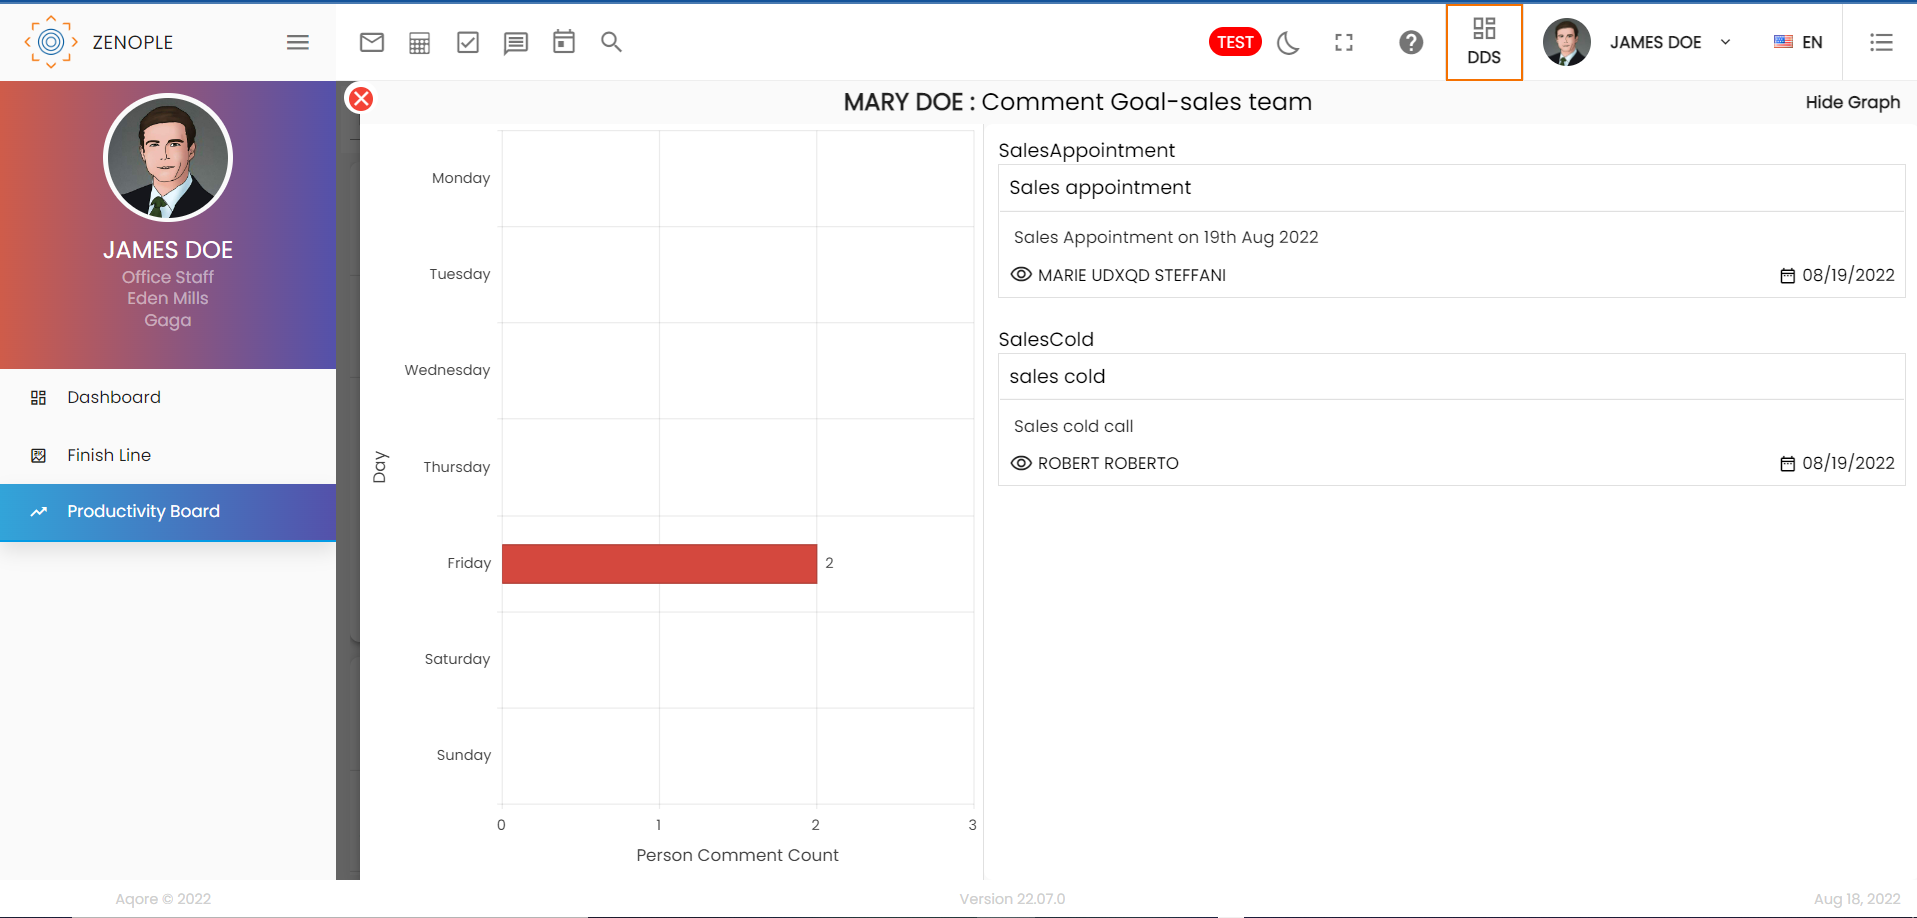
Click on the view graph icon to view the graph details of the goal count.
The graph is displayed based on the productivity goal frequency. In this case, the goal frequency was set to “Weekly” which is why the Count is displayed on the “Day” level in a week.
Productivity setup
This action is used when users want to create and set up goals for office staff using various productivity templates and parameters. Users can add goals for multiple office staff at once. Click on the settings icon from the productivity board dashboard to engage in this action.
There are three actions in the “Productivity setup” section. They are:
- Add
- Edit
- Refresh
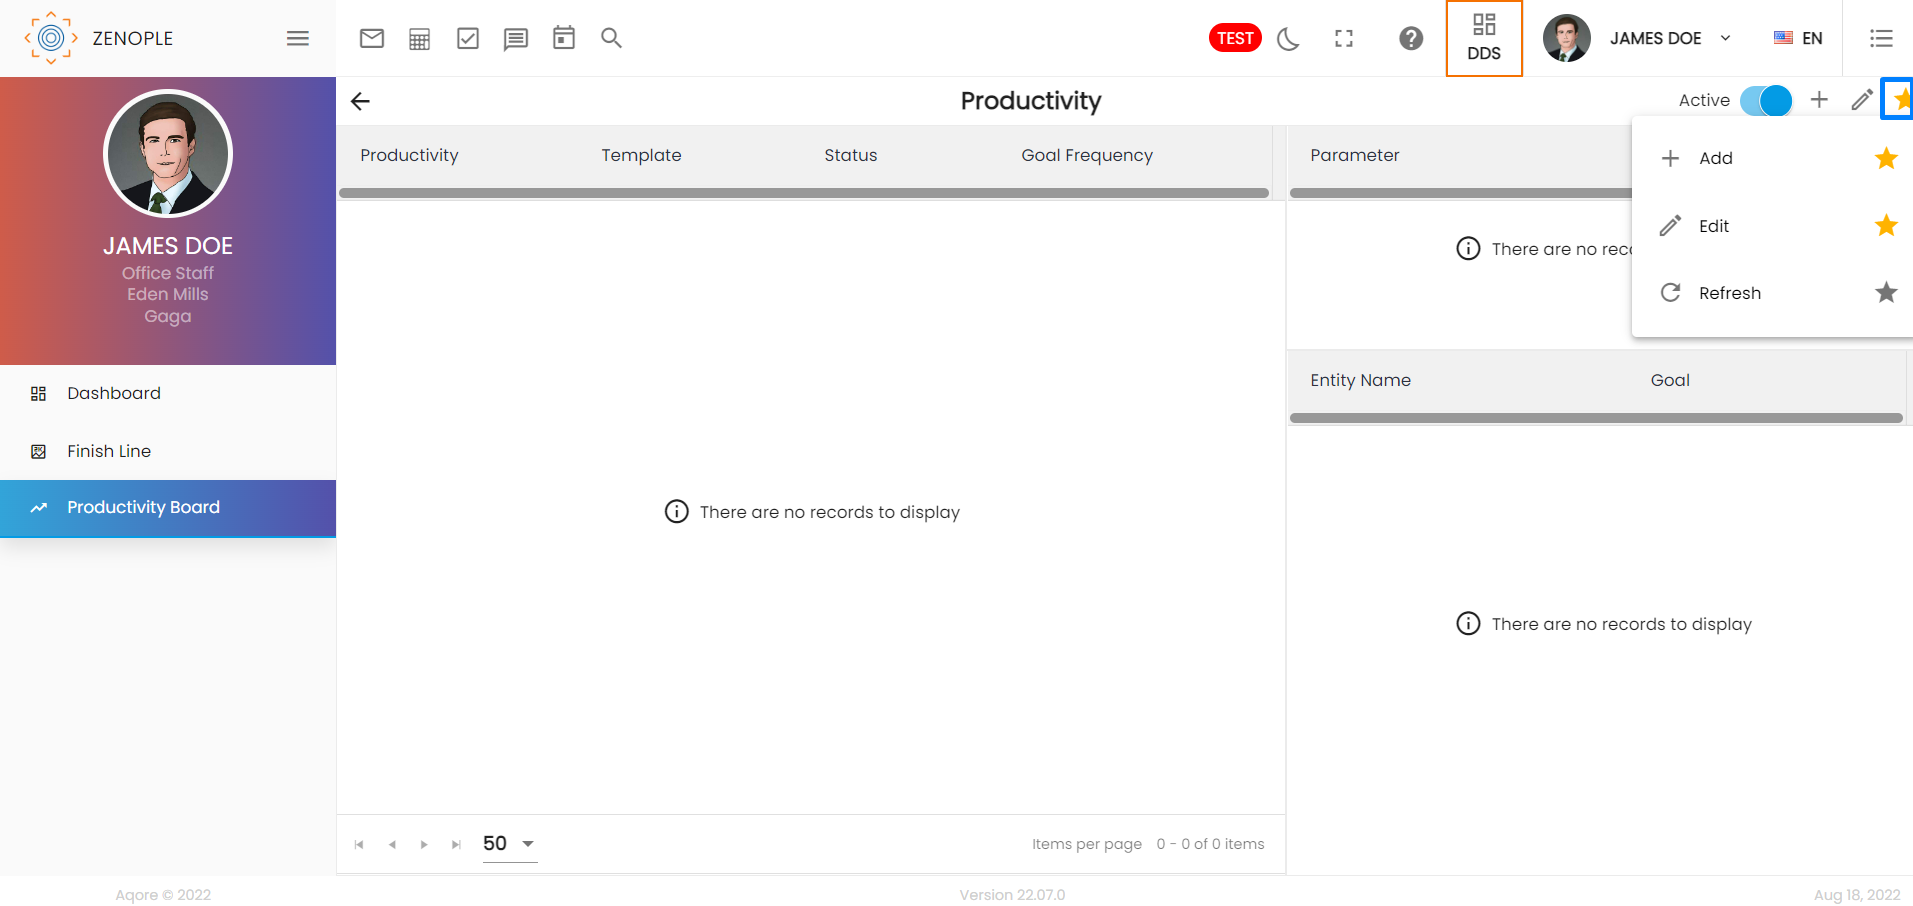
Add
Users can add the goals from the “Add” action.
Click on Add action from the favorite icon.
Choose the Productivity template as required from the dropdown. The templates available for now are:
- Person comment
- Customer comment
- Employee count
- Assignment count
- Person sales
- Office Sales
- Person Document
- Organization Document
Enter the name for the productivity.
Choose the status and productivity goal frequency as required. The goal frequencies available for now are:
- Weekly
- Monthly
- Quarterly
- Yearly
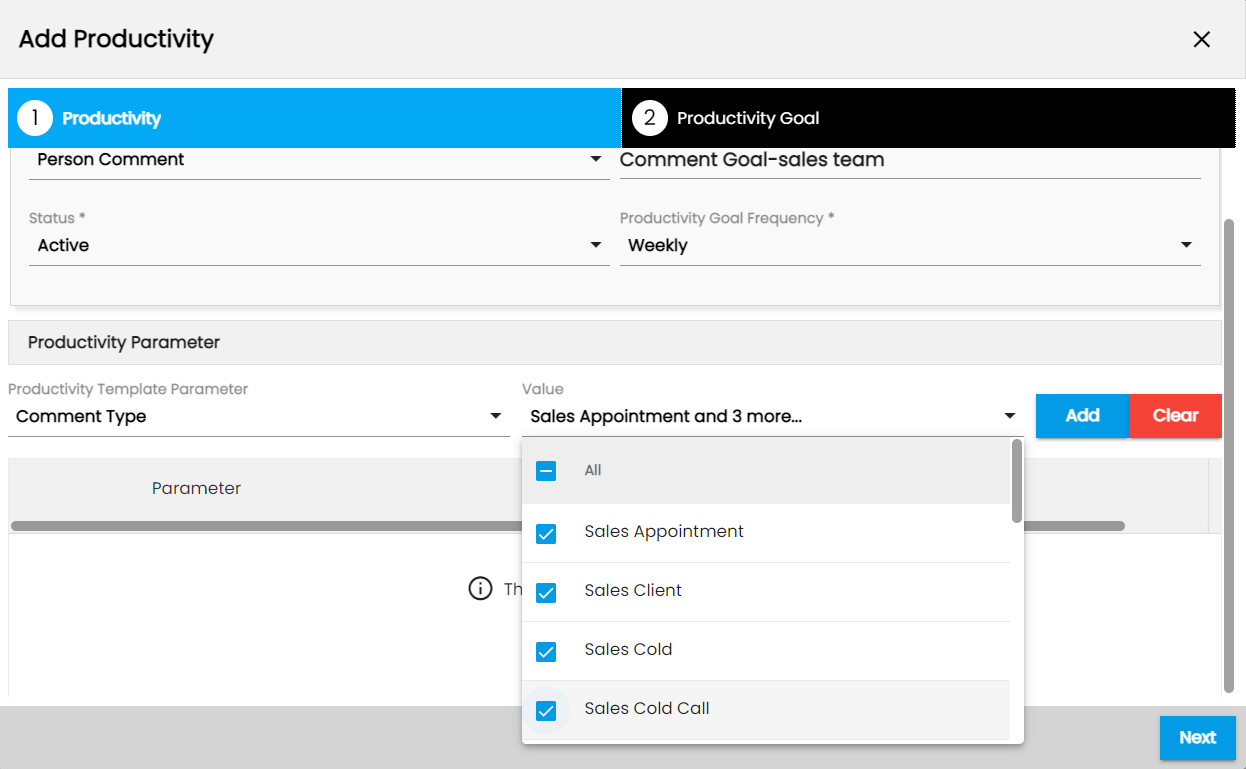
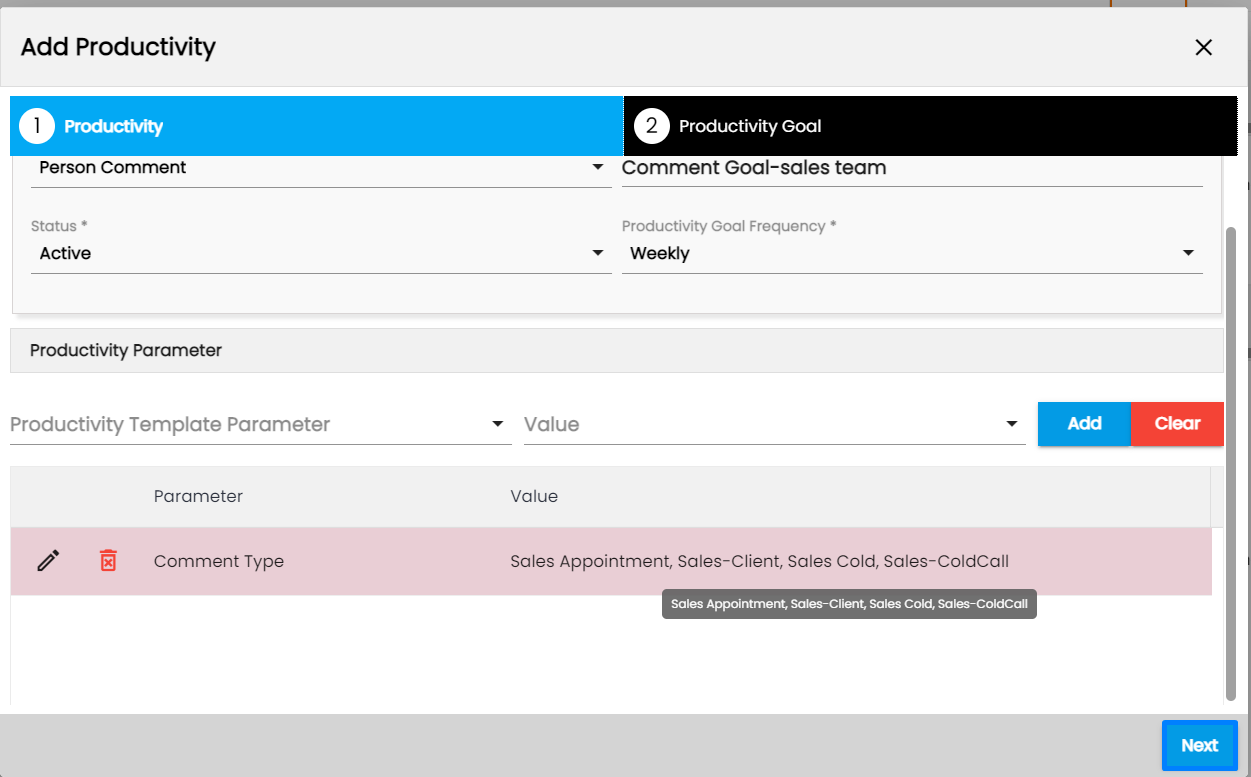
After the above steps, choose the parameters as required for goal calculation and click on “Add”. Users can select multiple parameters as required.
Click on the next button to set up the no. of goals.
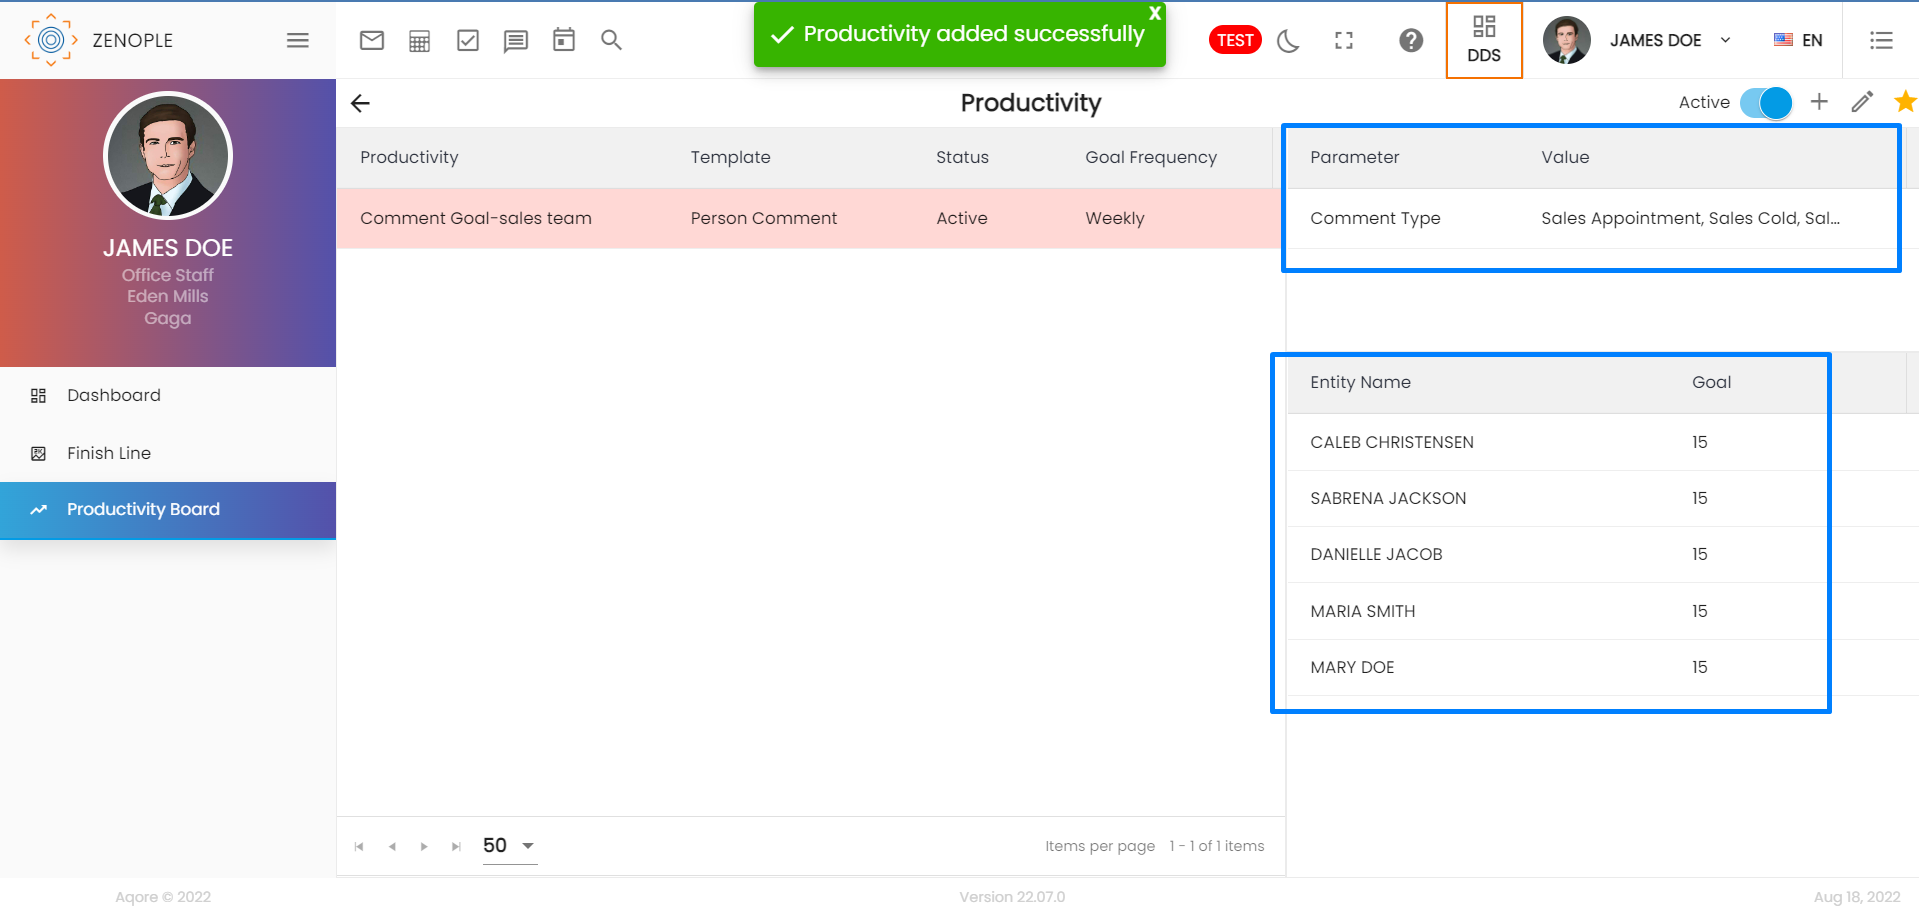
Based on the template selected, the entity selection is provided. Select the entities and enter the goal as required.
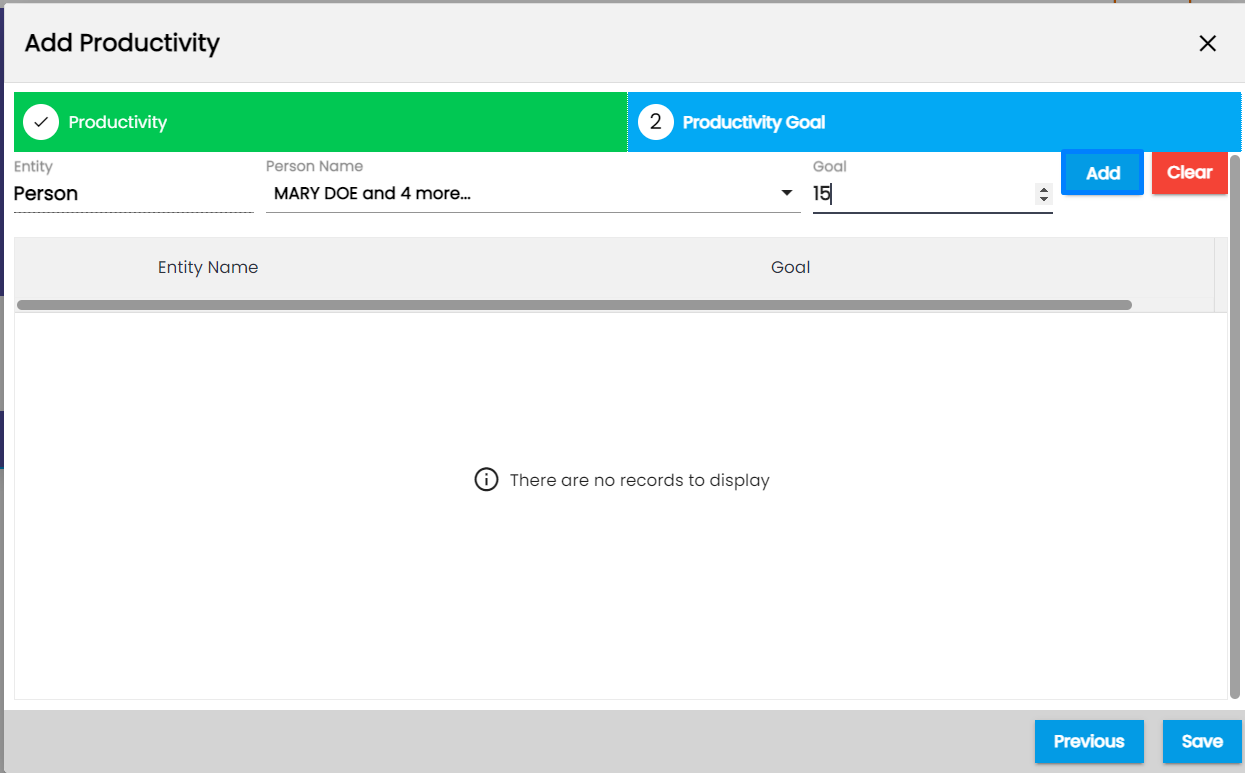
Click on Add button and save it.
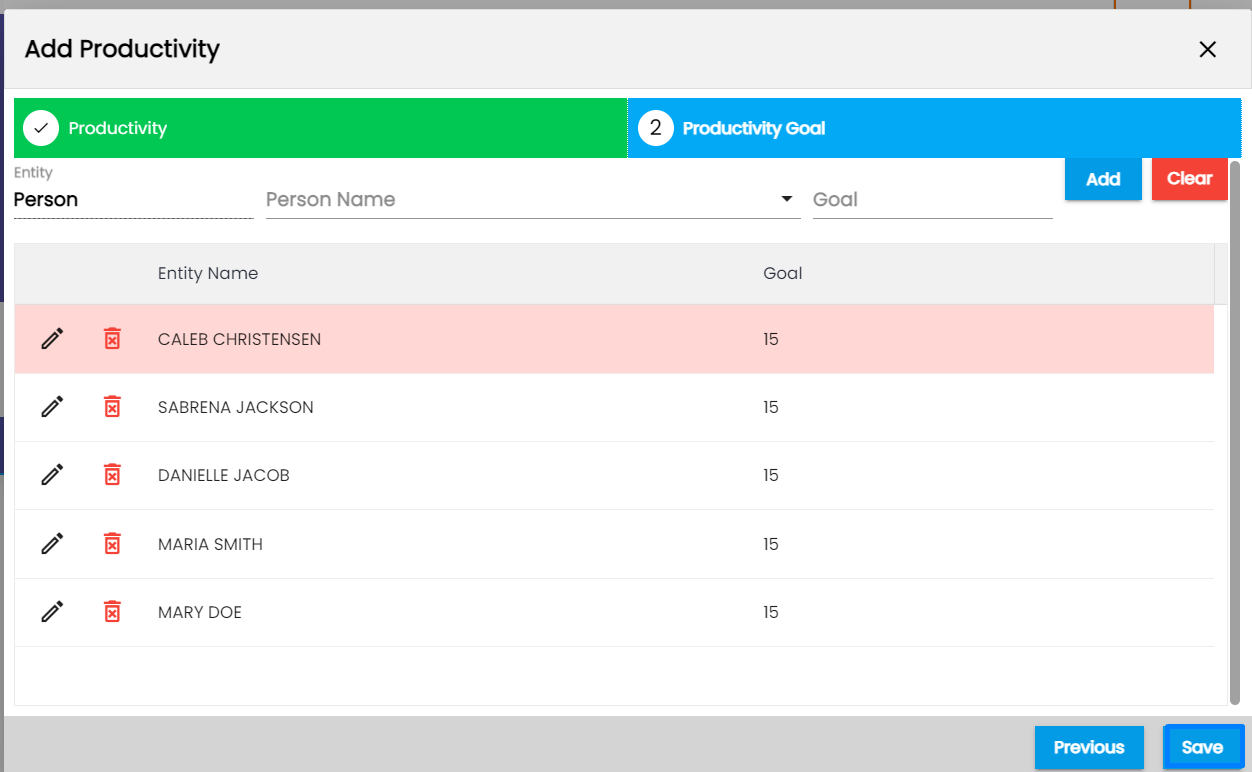
Once the productivity is added, the details about the goal and its parameters are reflected in the grid.
Edit
Users can edit the productivity name, frequency, parameters, goal count, and entity name but users cannot change the template of the productivity once created. In such cases, users can inactive the productivity template and create a new one.
Click on the Edit icon to edit the details.
Refresh
Click on the Refresh icon to refresh the details.
Toggle button
Users can turn on the toggle button to view active productivity and vice versa.
Finish Line
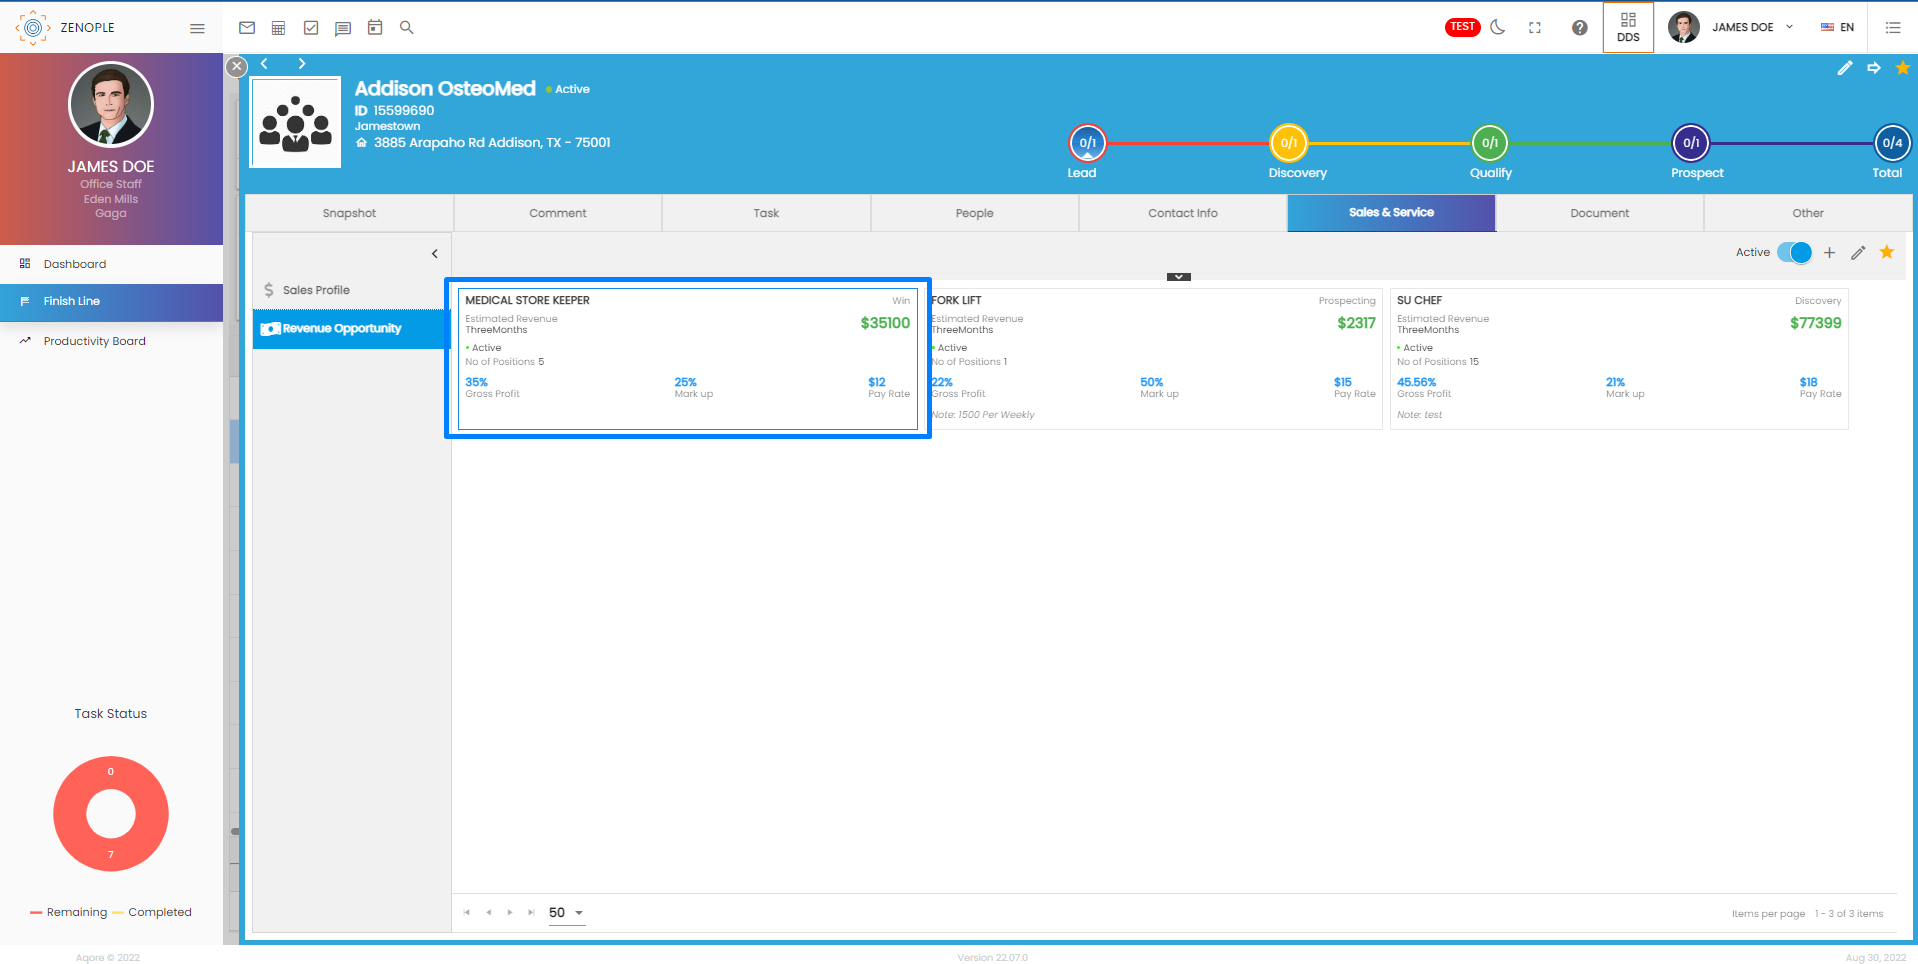
Finish Line main navigation has been implemented in the DDS Dashboard. It allows users to track multiple revenue opportunities with their estimated Gross values. The supporting navigation for the Finish line is the “Revenue Opportunity” navigation under an organization’s sales & service profile.
Adding the revenue Opportunity
There are three ways to add the revenue opportunity.
- Manual
- Estimated Calculation
- User
This is based on the option property “CalculateEstimatedRevenue” on the office level.
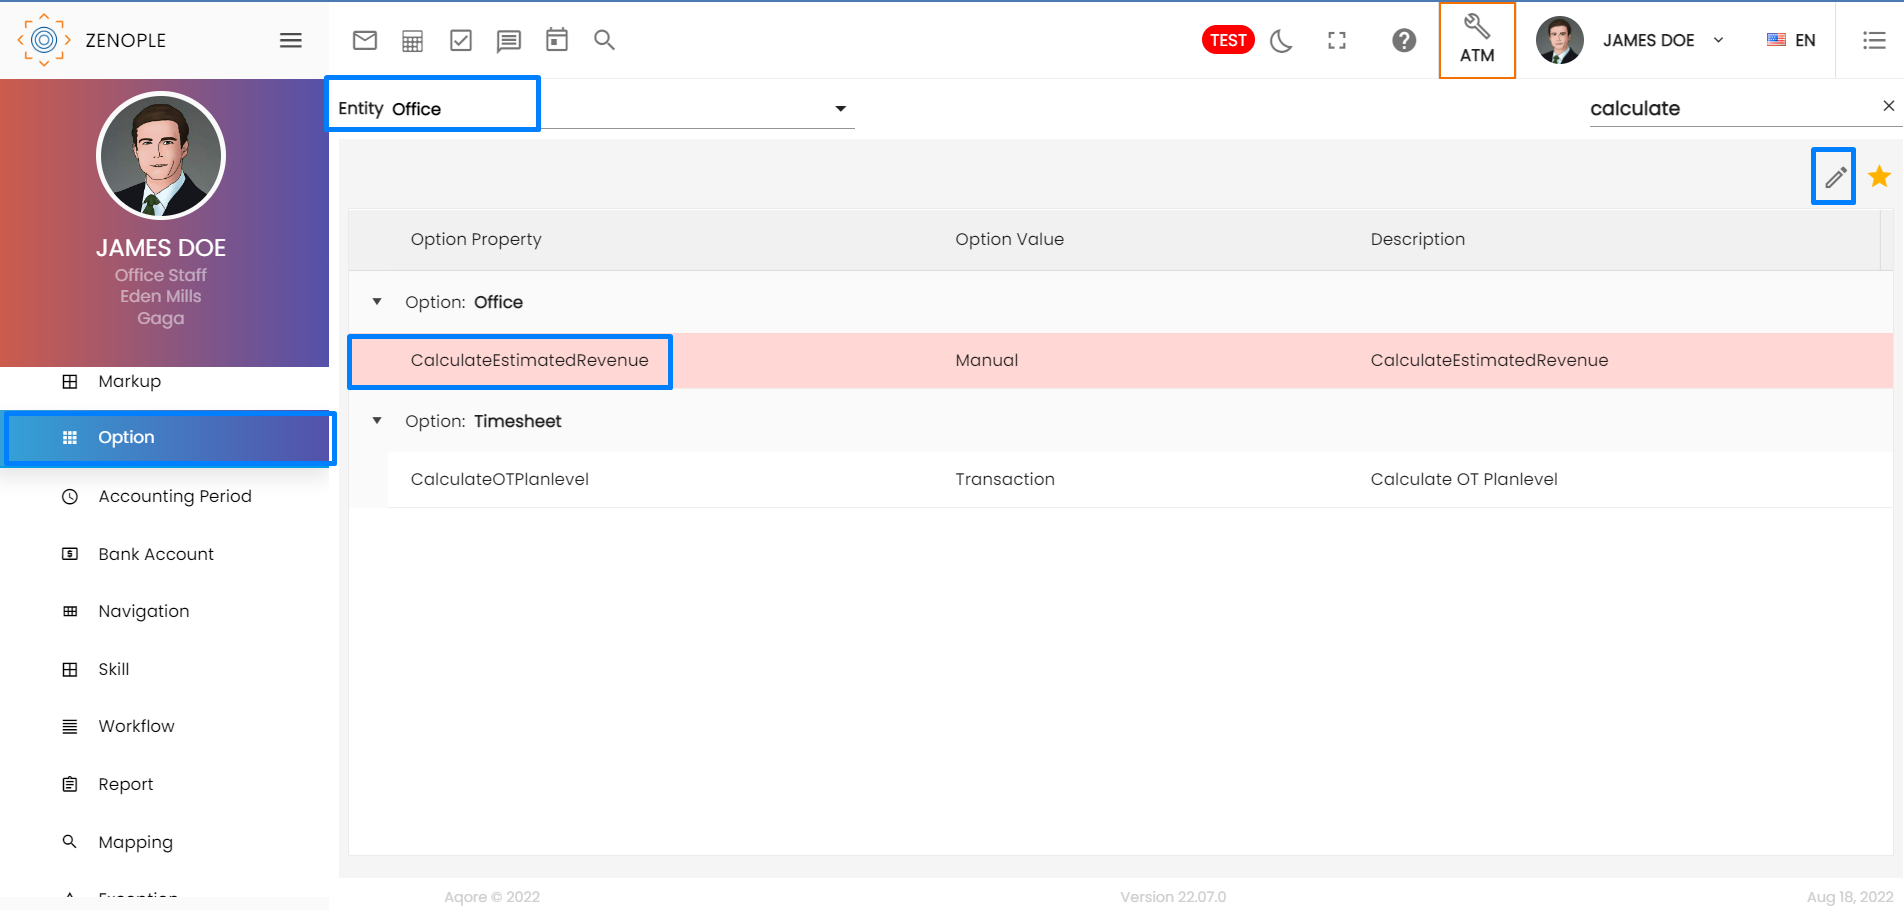
- Go to Option Property from the ATM application.
- Select Office from the entity dropdown.
- Select the “CalculateEstimatedRevenue” option property and edit it.
Select the required value and select the office to provide this setup and save it.
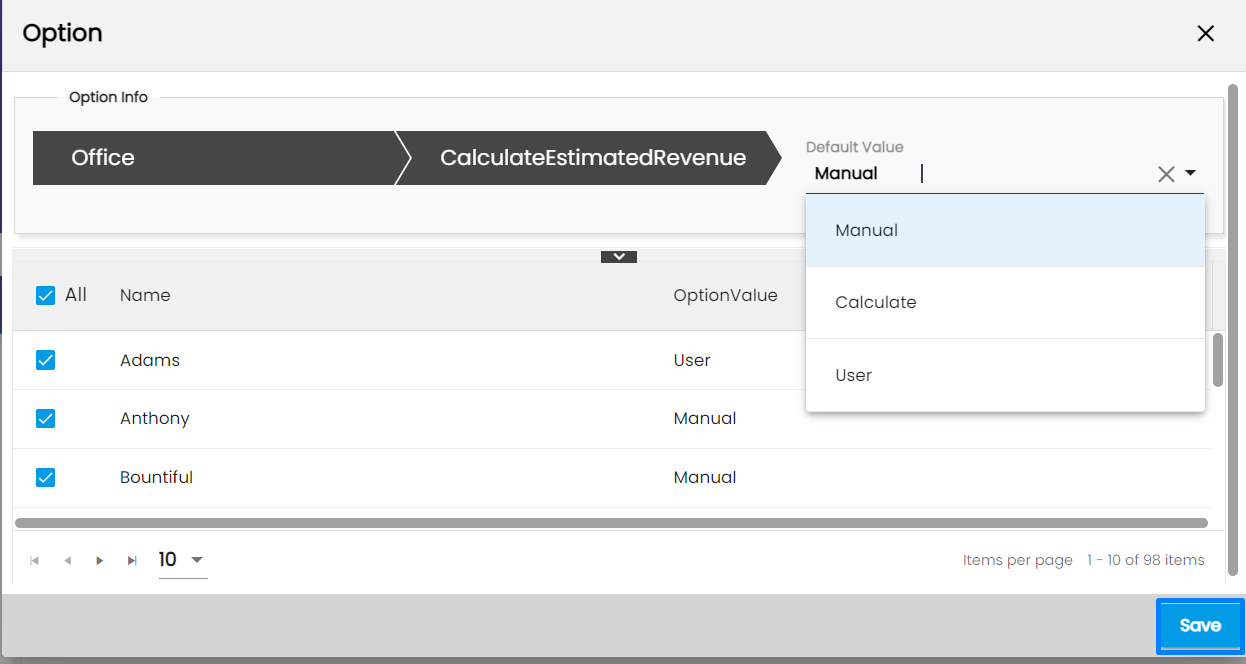
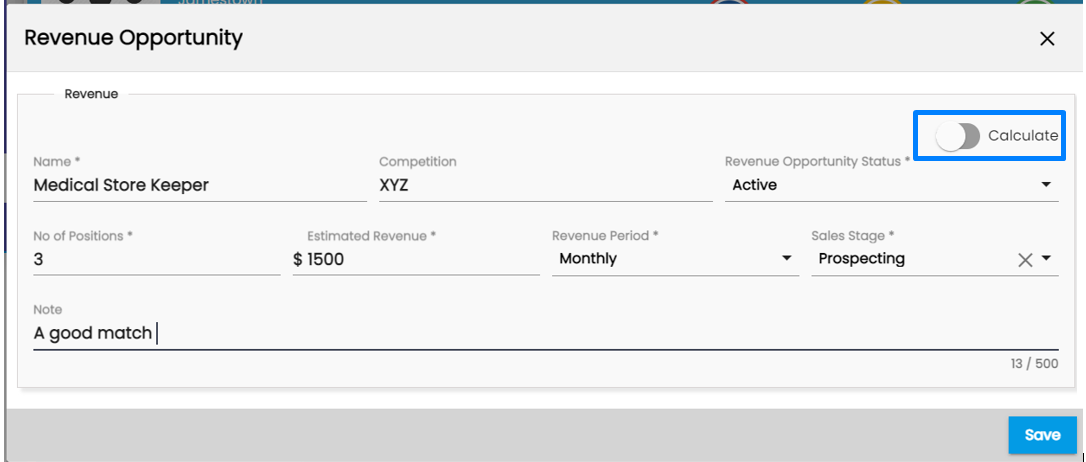
The value “Manual” allows the user to add the revenue opportunity manually. (Estimated revenue)
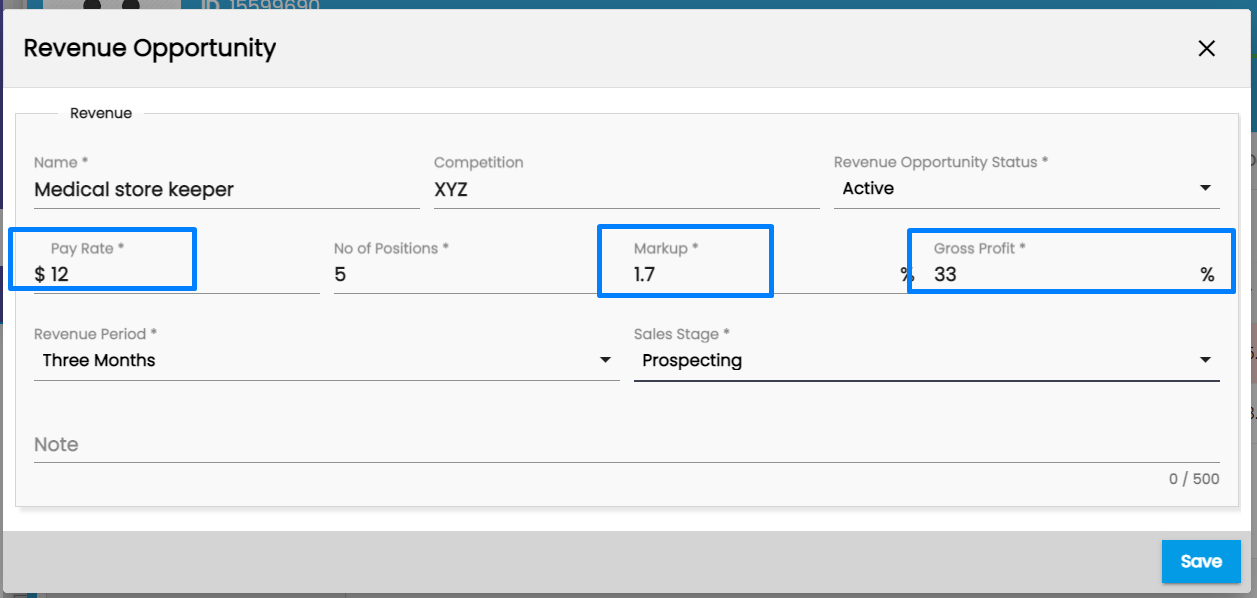
The value “Calculate” allows the user to add the revenue opportunity calculatedly. The user must enter the pay rate, markup, and GP percent. Based on those data, the estimated revenue is calculated.
The value “User “allows the user to enable the toggle button to “Manual” or “Calculate” and add the revenue opportunity as desired.
Go to an organization’s detail page. The organization may be a lead, target, new customer or a customer.
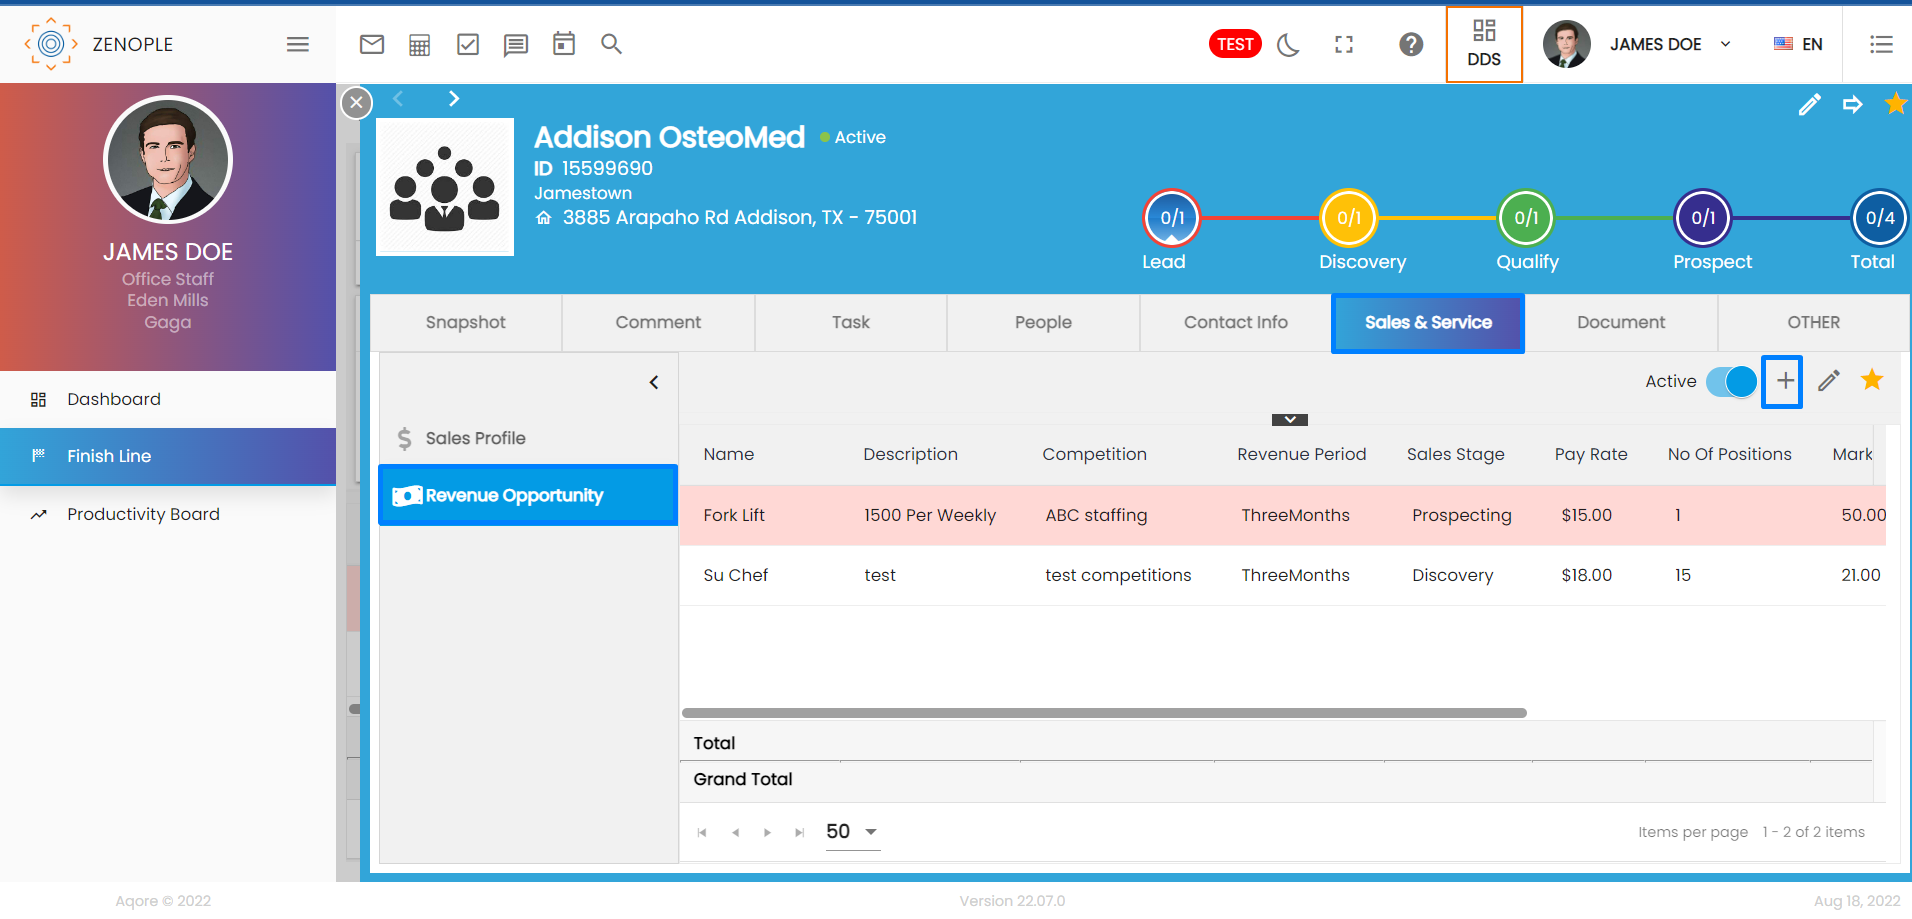
Click on Sales and service profile top navigation.
Click on revenue Opportunity side navigation.
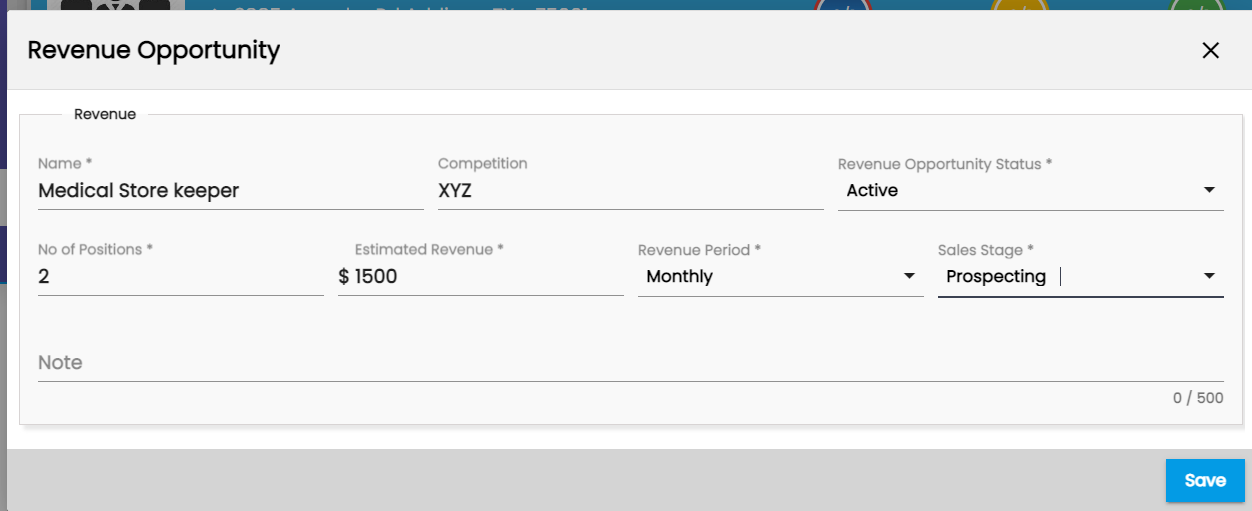
Add the revenue Opportunity from the add icon.
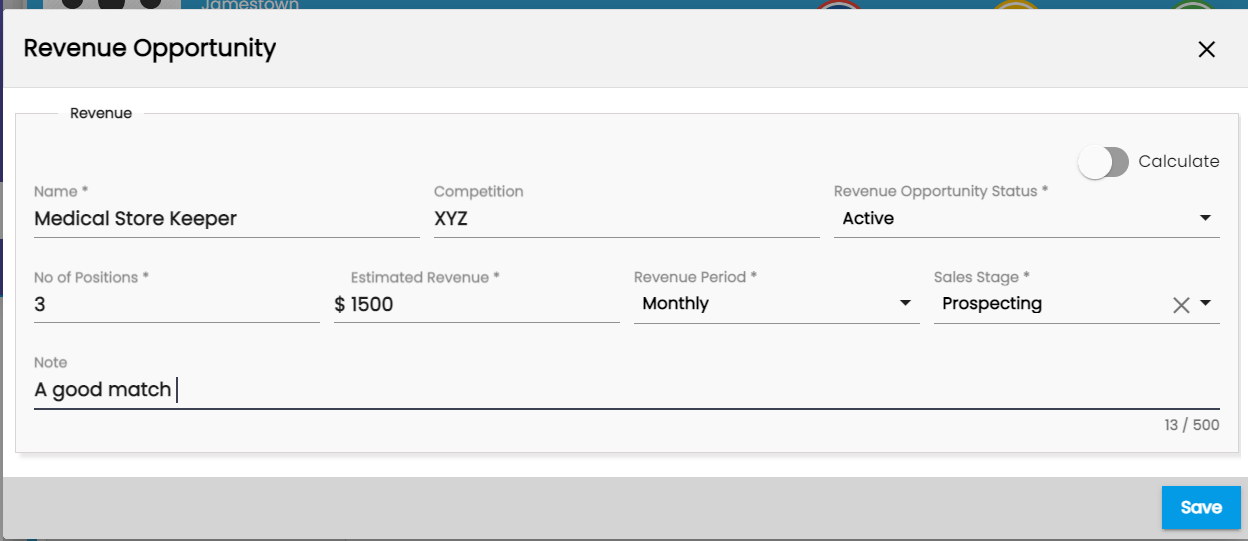
- Enter the revenue Opportunity name, status, no. of positions, estimated revenue, revenue period and sales stage.
- Click on the Save button.
There are five stages of sales for the finish line and they are:
- Prospecting
- Discovery
- Proposing
- Closing
- Win
Once the revenue opportunity is added, it is reflected in the Revenue Opportunity grid as well as in the Finish line Dashboard.
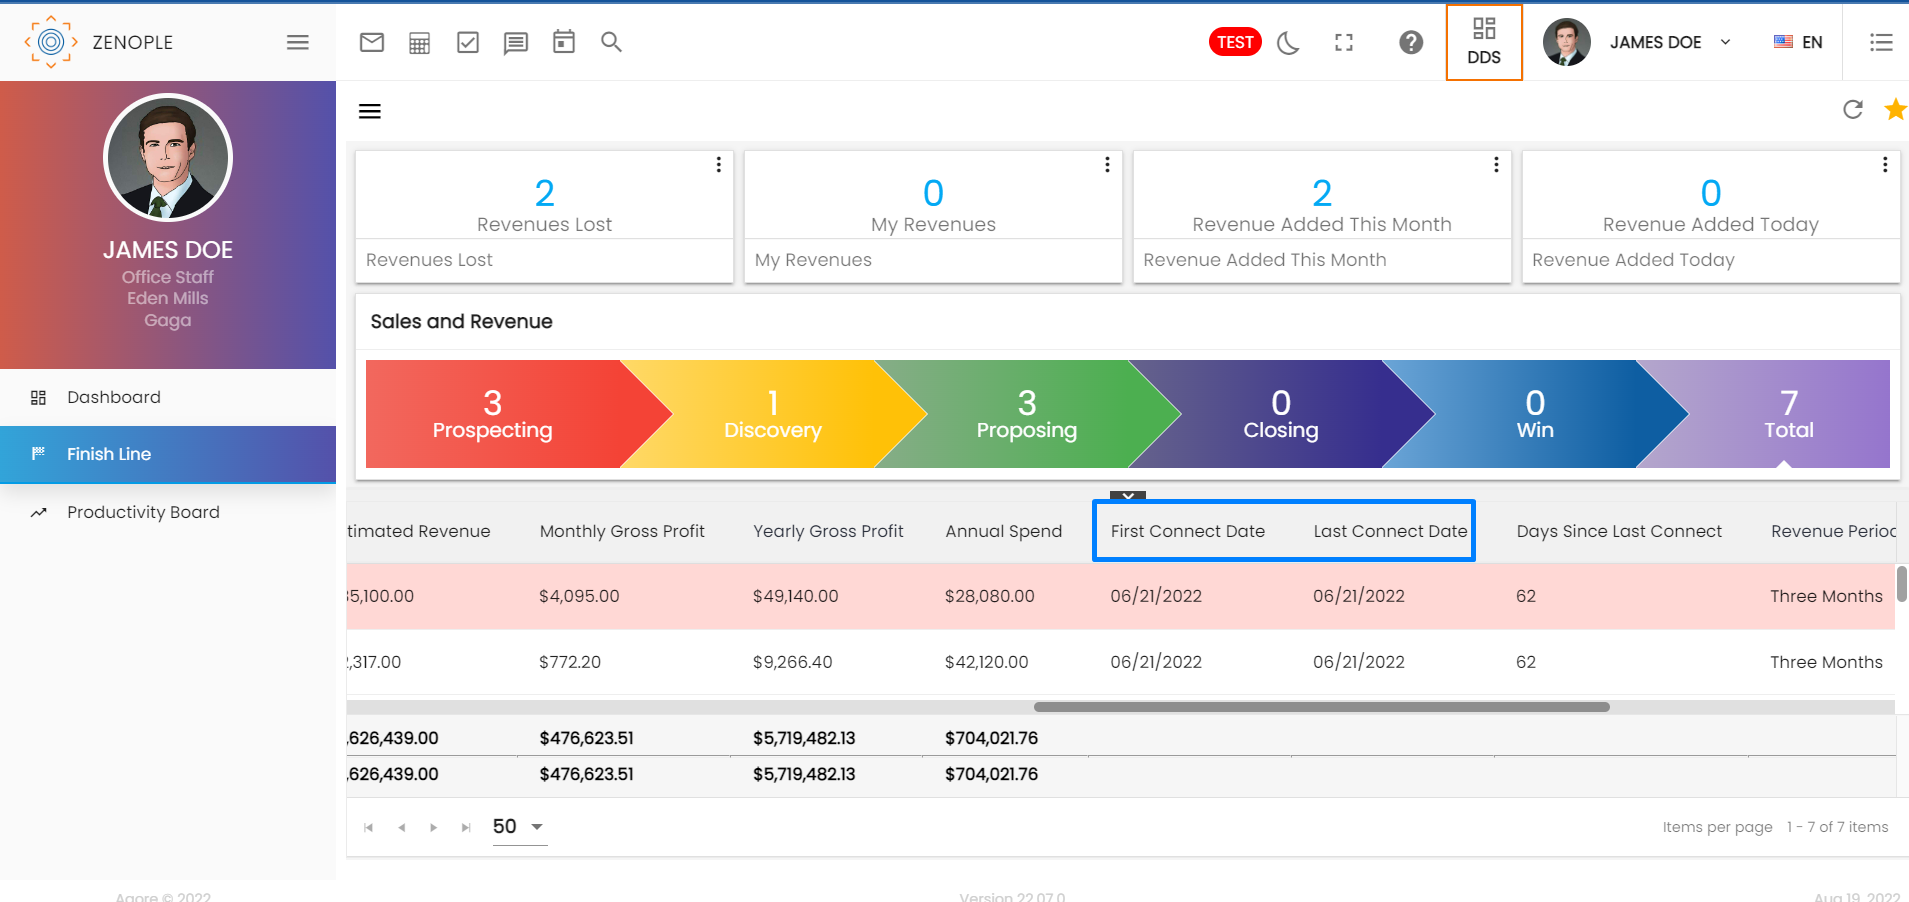
Finish Line dashboard
The revenue opportunities added from the “Revenue Opportunity” navigation are displayed in the directory. The information about the revenue opportunity, pay rate, no. of positions, estimated revenues, markup percent, monthly gross profit, yearly gross profit, annual spend, revenue period, and note are all reflected from the revenue opportunity navigation and calculated based on that information.
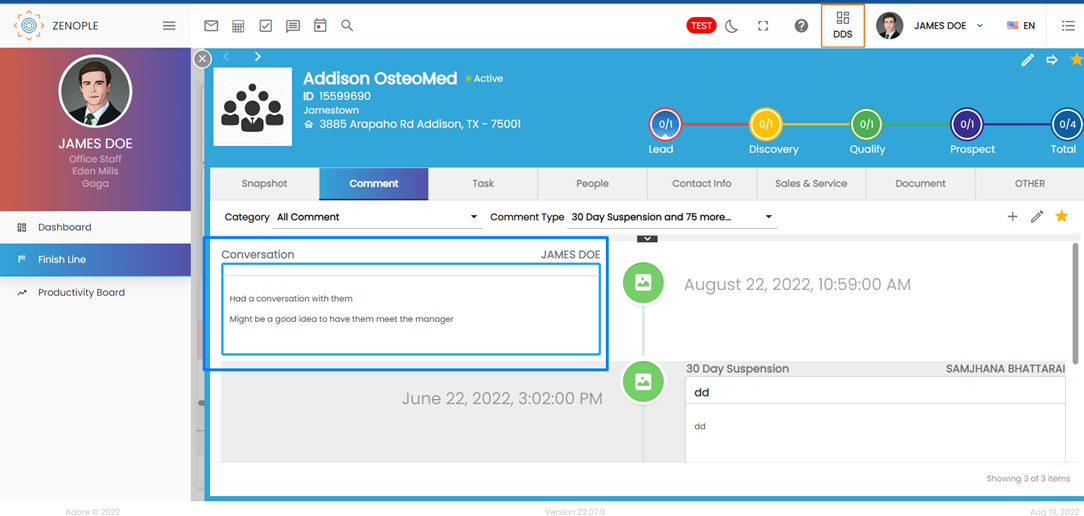
Other than that, the “First connect date” column defines the first connect date, which simply displays the first date of any comment under the “sales connect” category whereas the “last connect date “ displays the latest comment date of any comment under the “sales connect” category.
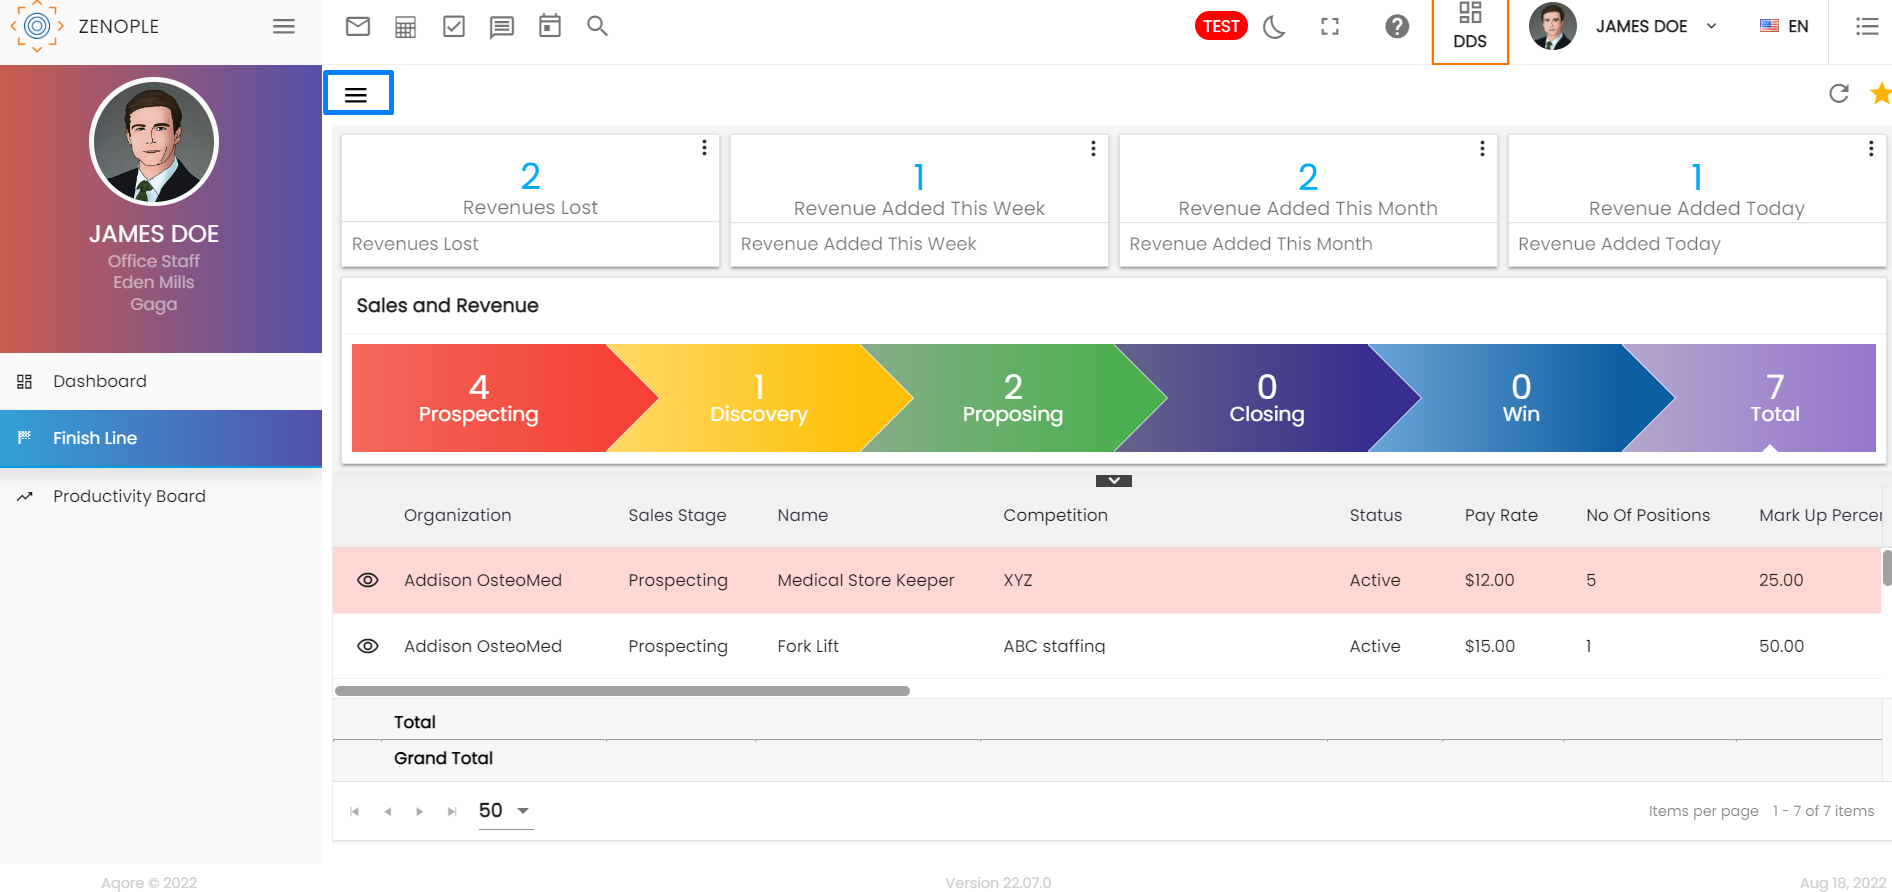
The Dashboard contains Filters, Tiles, and stages. Users can also redirect to the entity detail page from the eye view icon.

Tiles
There are six tiles in the Finish line Dashboard. They are:
- Revenue Added This Today: The count of revenue opportunities added today from the Revenue Opportunity side navigation of the sales and service profile of customer detail is displayed here.
- Revenue Added This Week: The count of revenue opportunities added this week from the Revenue Opportunity side navigation of the sales and service profile of customer detail is displayed here.
- Revenue Added This Month: The count of revenue opportunities added this month from the Revenue Opportunity side navigation of the sales and service profile of customer detail is displayed here.
- Revenue Added This Year: The count of revenue opportunities added this year from the Revenue Opportunity side navigation of the sales and service profile of customer detail is displayed here.
- Revenue Lost: The count of total revenue opportunities that have the status “Lost” is displayed here.
- My revenues: The count of revenue opportunities that the user has added will be displayed here.
- My Branch Revenues: Users can click on each tile and view the revenue opportunities as required.
.png)
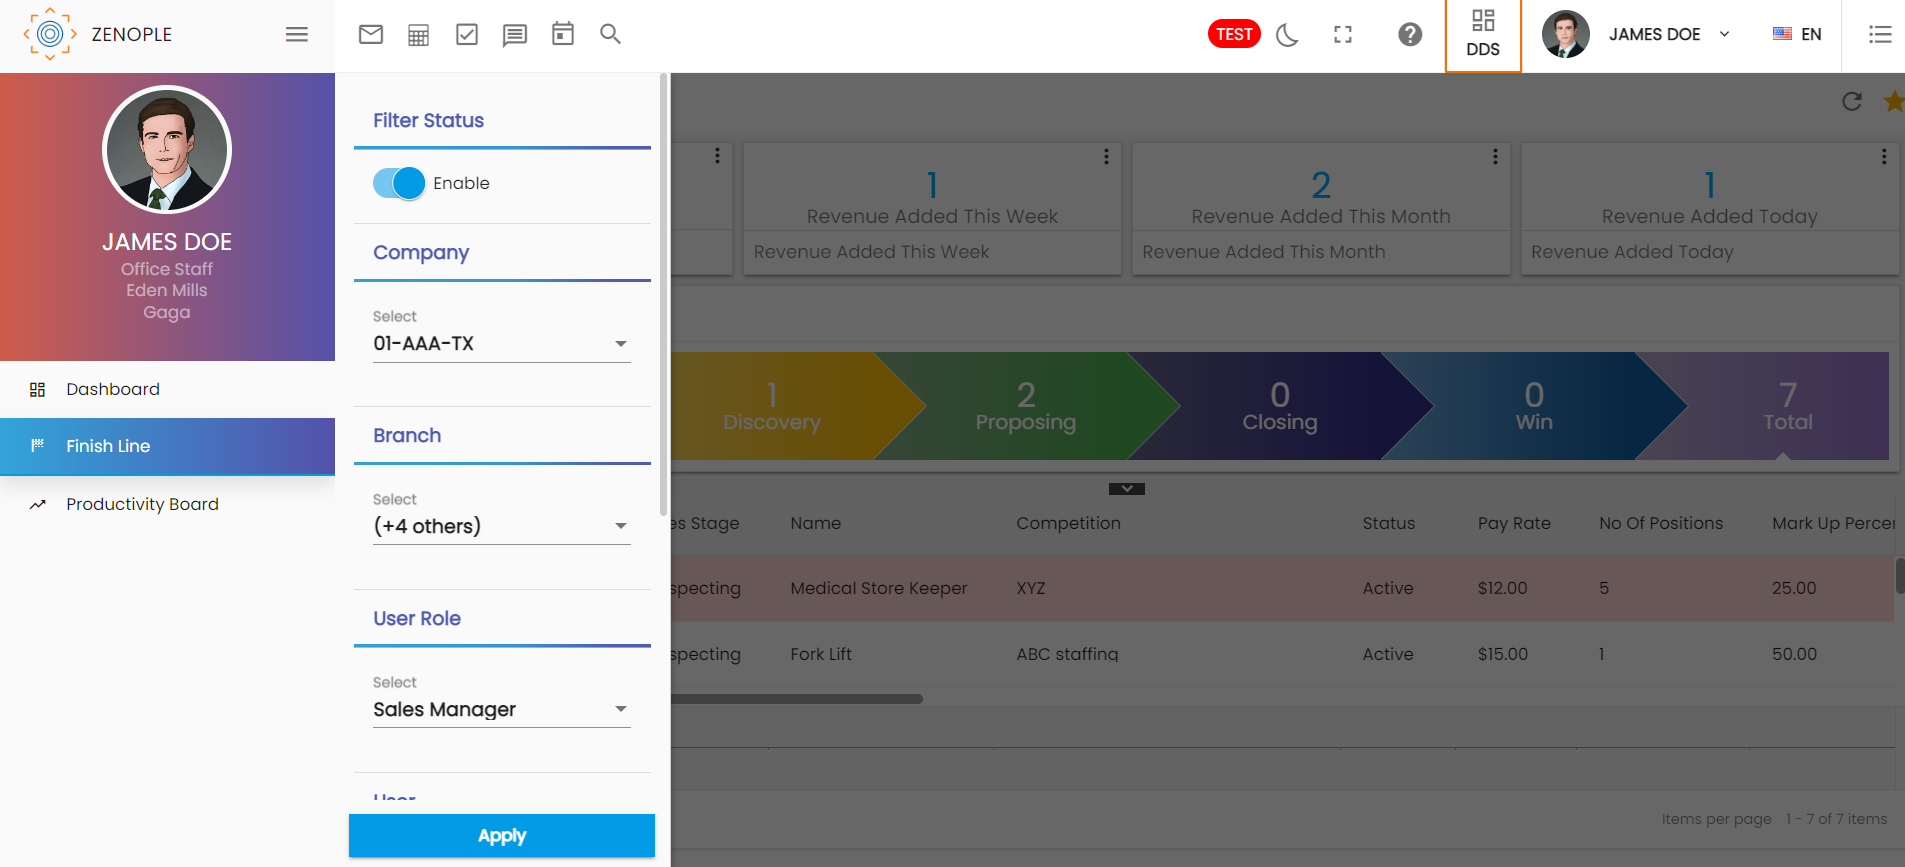
Filter
The Dashboard also contains a filter. This can be used from the Hamburger icon.
Users can filter the revenue opportunities by various companies, branch, user roles, users, and status.
For now, the user type included is Sales Manager and Sales Rep as standard.
When the user type and users filter is used, the filter will display the revenue opportunities in which the users are tagged as the selected user types.
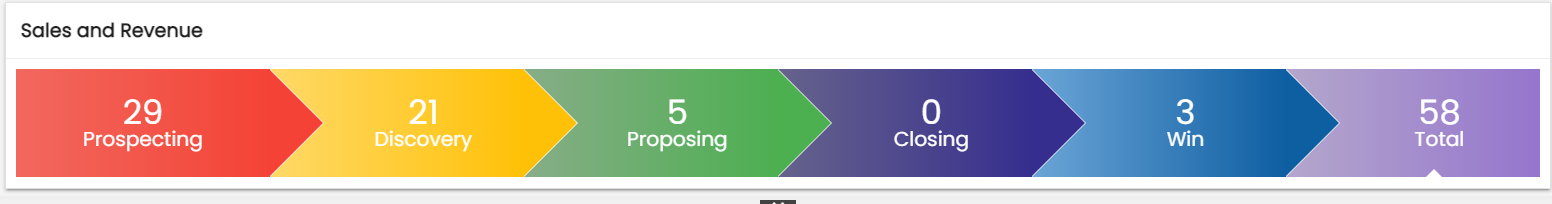
Stages
There are five stages of sales for the finish line and they are:
- Prospecting
- Discovery
- Proposing
- Closing
- Win
Users can click on the stages as required and view the revenue opportunities on those stages in the directory.
Users can simply change the stage of the revenue opportunity directly from the directory page as well without going to the revenue opportunity navigation.
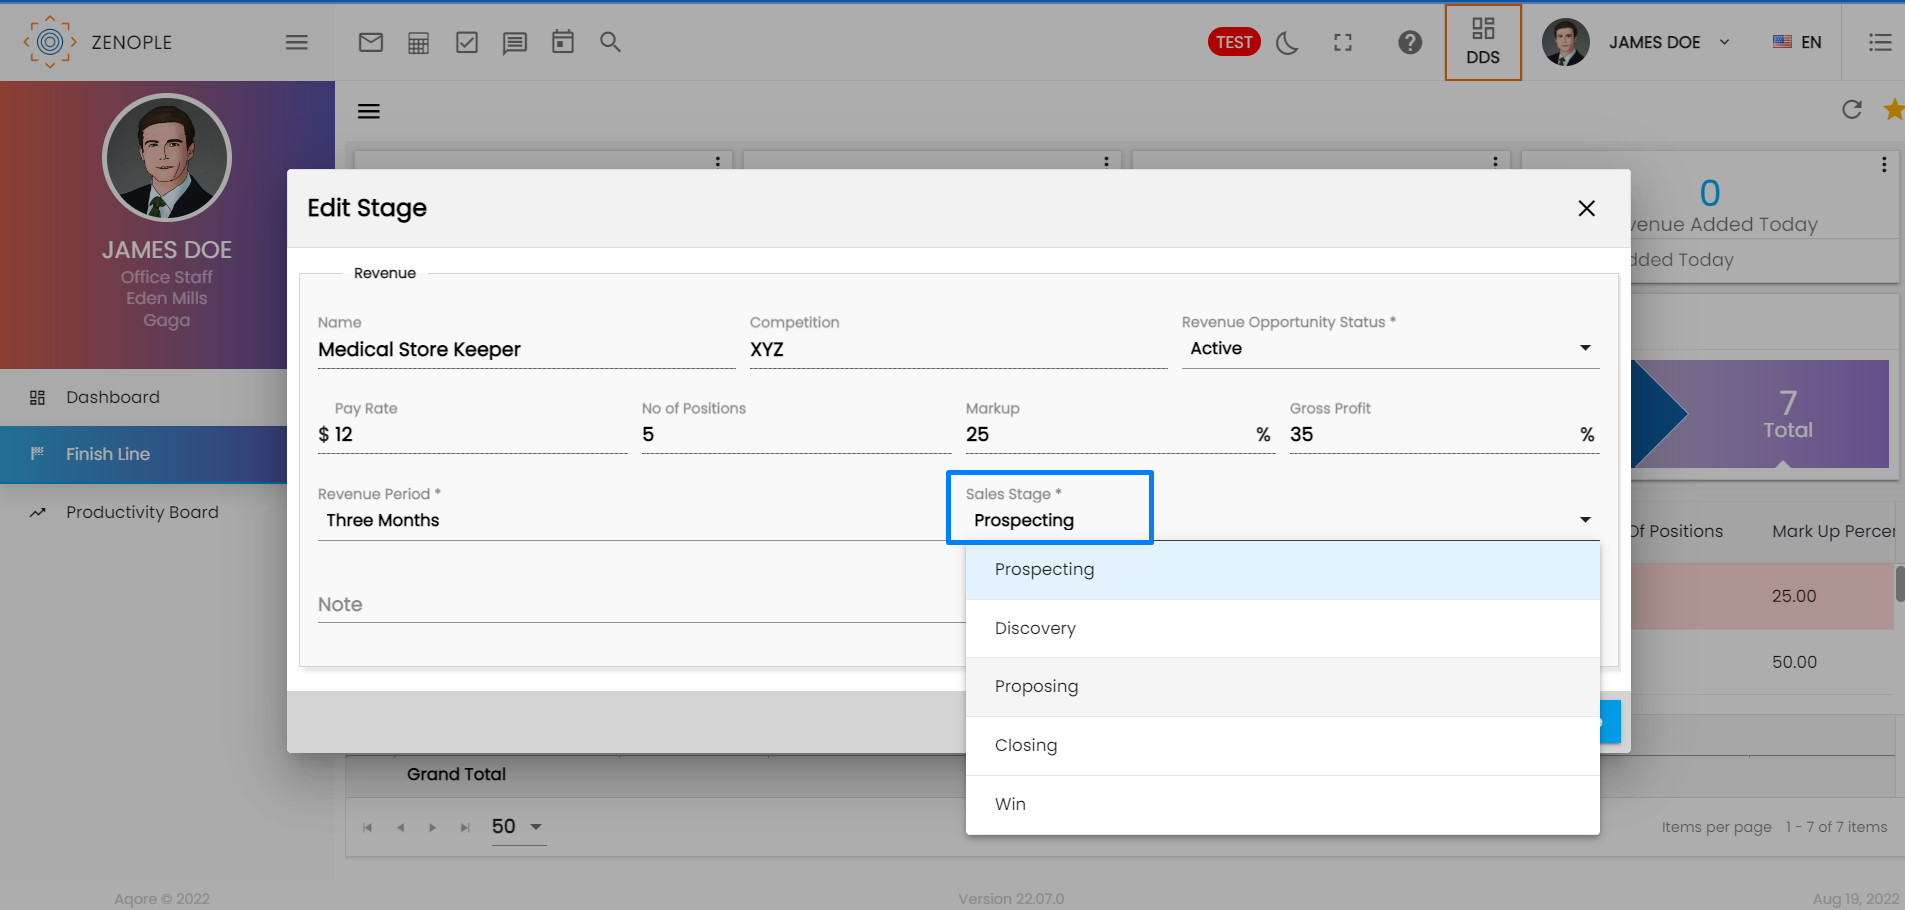
Select the revenue opportunity and click on the Edit icon from the favorite icon.
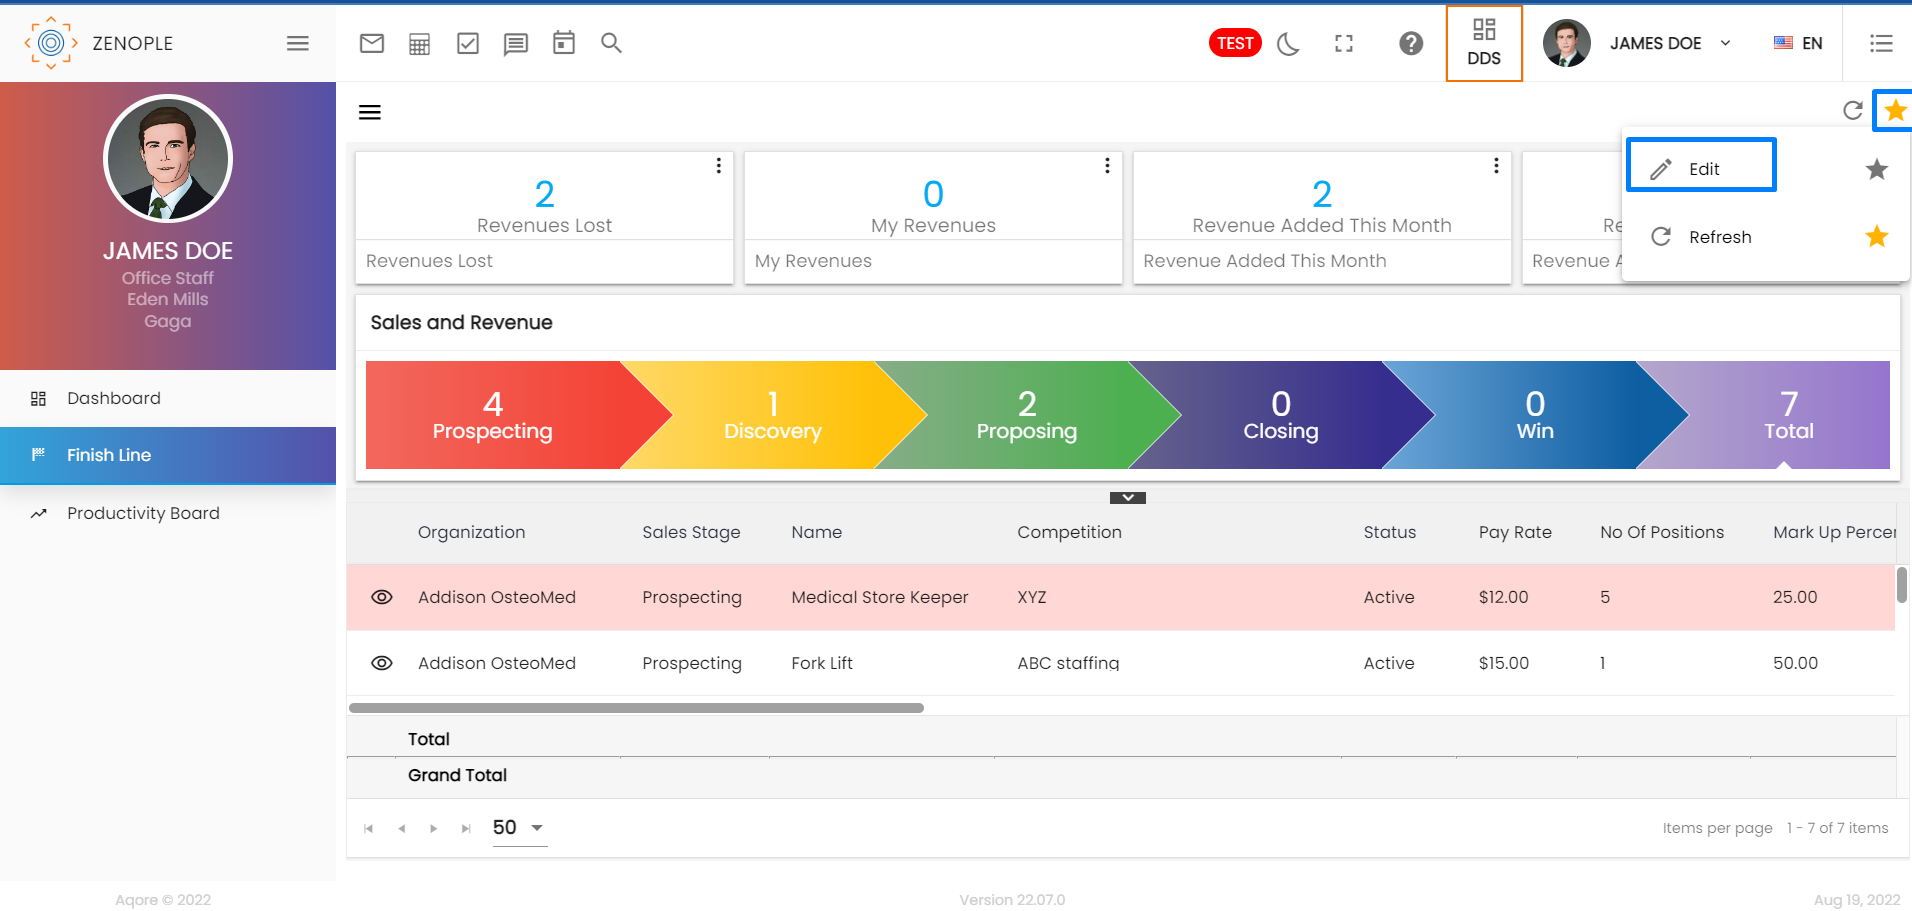
Change the sales stage as required and save it.
Once the user changes the sales stage, the user is asked for confirmation to add a comment as required.
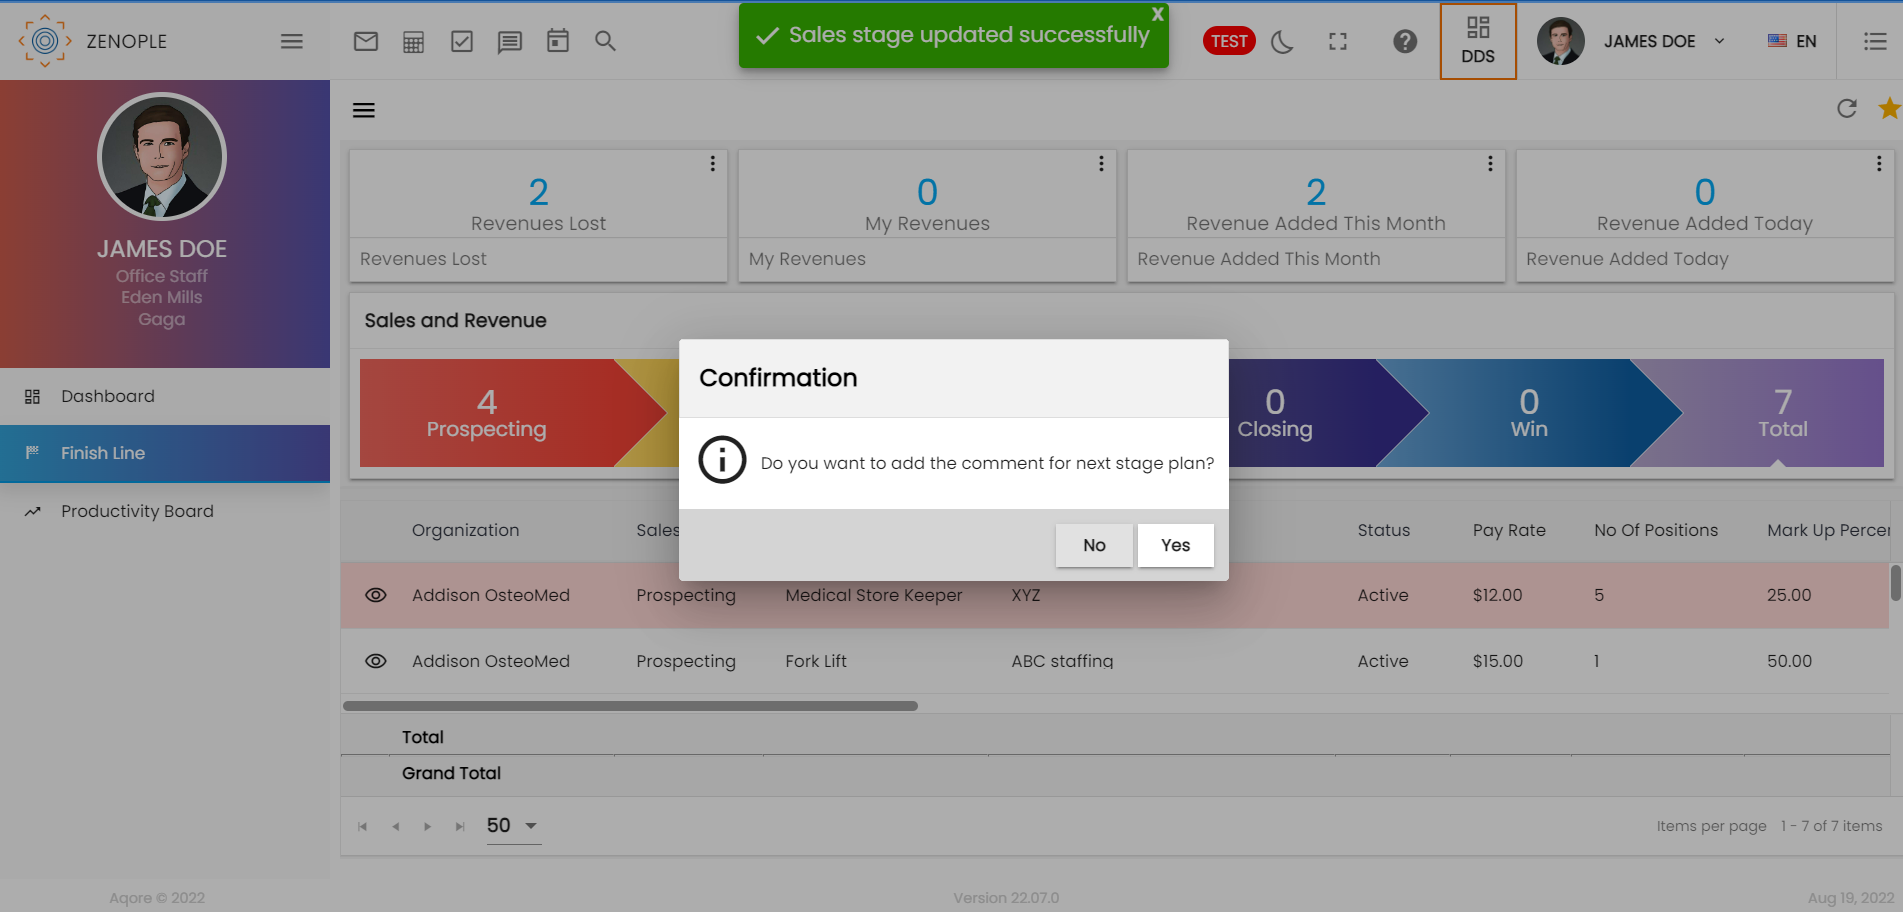
If the user clicks on “Yes” to add a comment, the comment screen is opened.
Add a comment as required and save it.
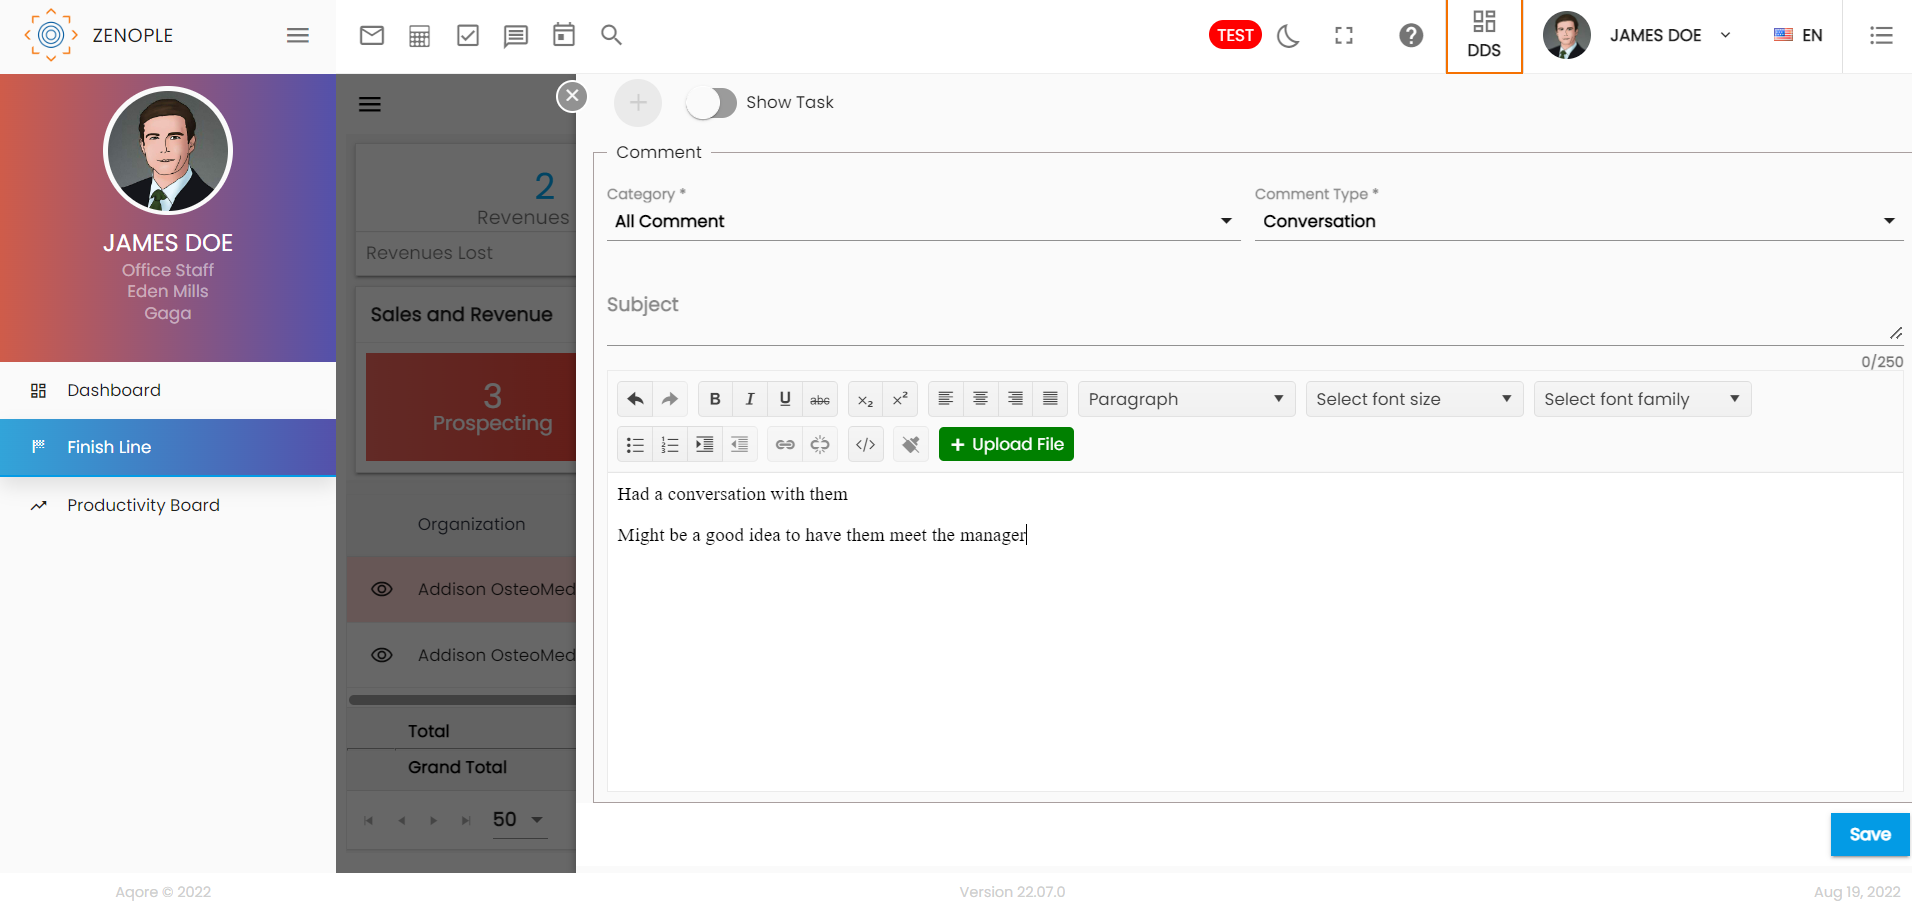
The added comment is then reflected in the comment navigation of the entity’s detail page.