Overview
The dashboard is the first landing page of TMS. Timesheet dashboard shows the summary of the organization as per the selected accounting period. It shows the 'Total Bill,' 'Sales,' 'Gross Profit,' 'Gross Profit %,' 'Total Pay,' 'Gross,' 'Reimbursement,' and 'Deduction.'
Navigate to the 'Dashboard' to view the summary by selecting a company and an accounting period.
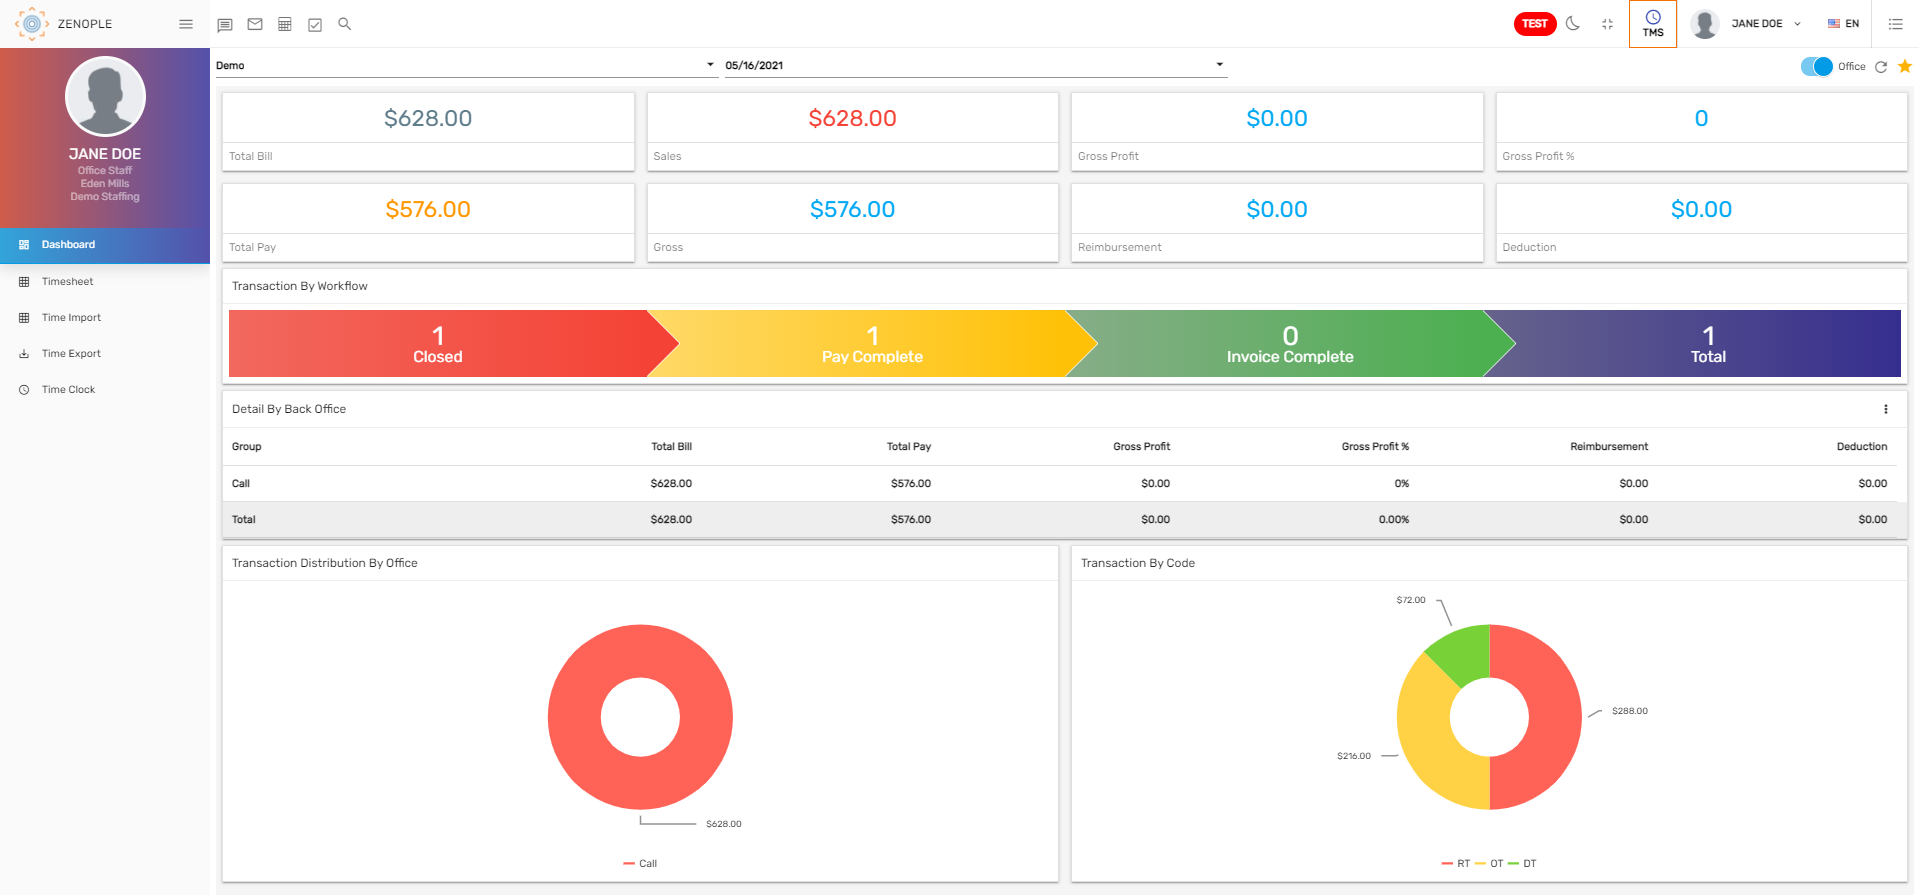
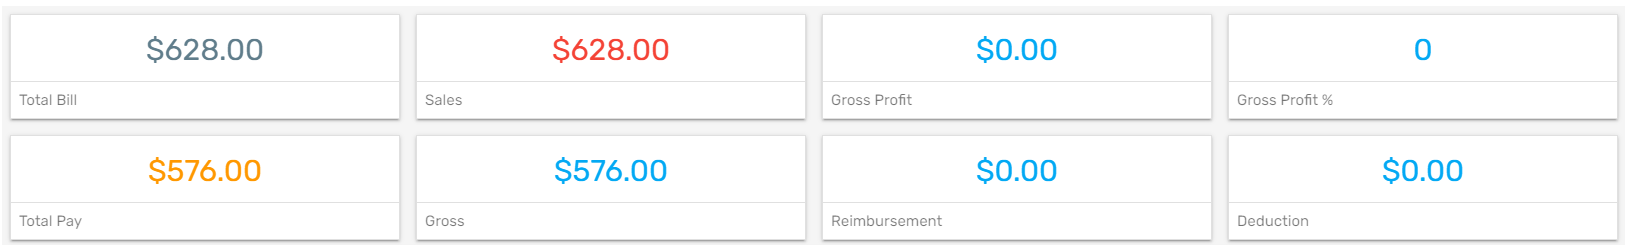
Tiles
Tiles in TMS represent the count of the records holding information about the bills, sales, profit, reimbursement, and deduction.
Users can access information such as 'Total Bill,' 'Total Pay,' 'Sales,' 'Gross,' 'Reimbursement,' and 'Deduction' based on the company and accounting period they have chosen.
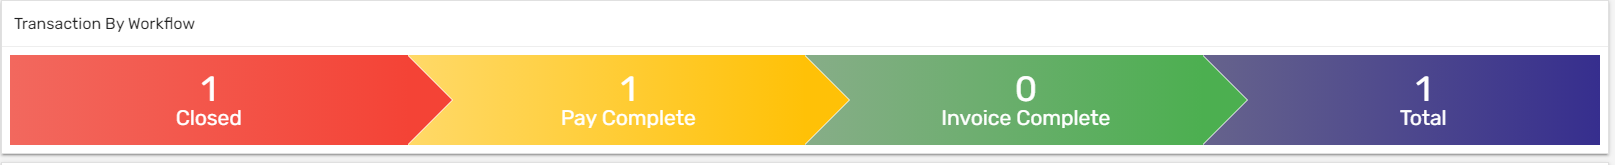
Transaction by Workflow
Below the tiles, transactions by the workflow are displayed. Dashboard workflow contains 'Closed,' 'Pay Complete,' and 'Invoice Complete' count of the timesheet.
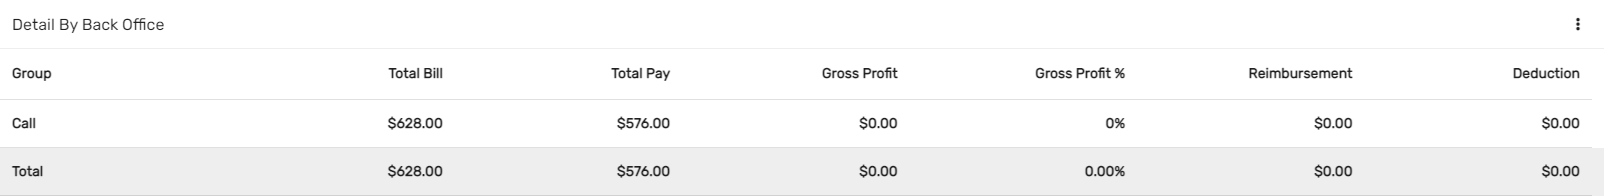
Detailed Table
The dashboard displays information such as 'Total Pay,' 'Total Bill Deduction,' 'Reimbursement,' and 'Profits' based on the various filters.
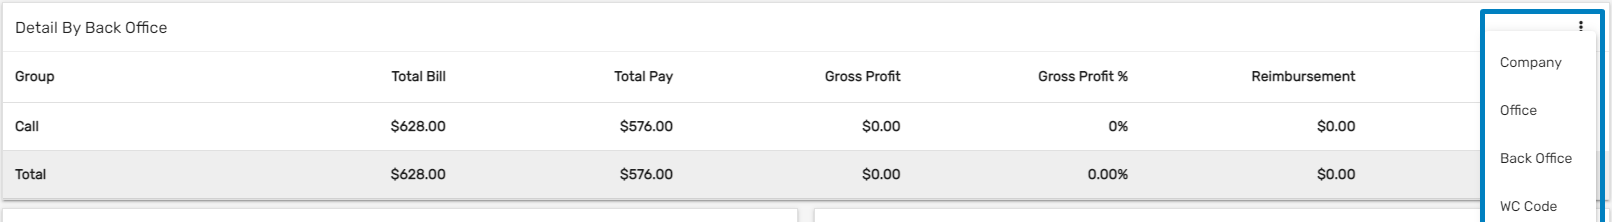
Details can be viewed using several filters from the vertical ellipsis on the right side and it includes 'Company,' 'Office,' 'Back Office,' and 'Wc-code.'
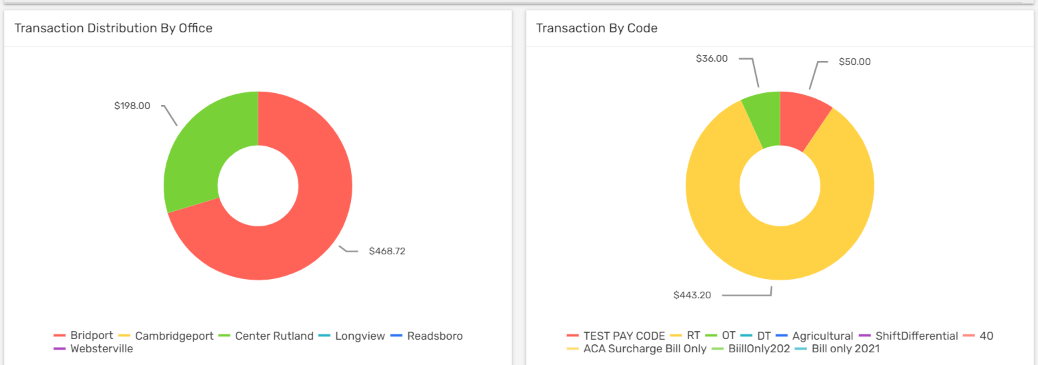
Donut Chart
There are two donut charts in the dashboard 'Transaction Distribution by Office' and 'Transaction by Code.'
'Transaction Distribution by Office' shows the total transaction amount of all the offices of the client individually while 'Total Pay by Code' shows the Regular time, Overtime, Double time, and Bonus amount individually as per the selected accounting period and company.