Overview
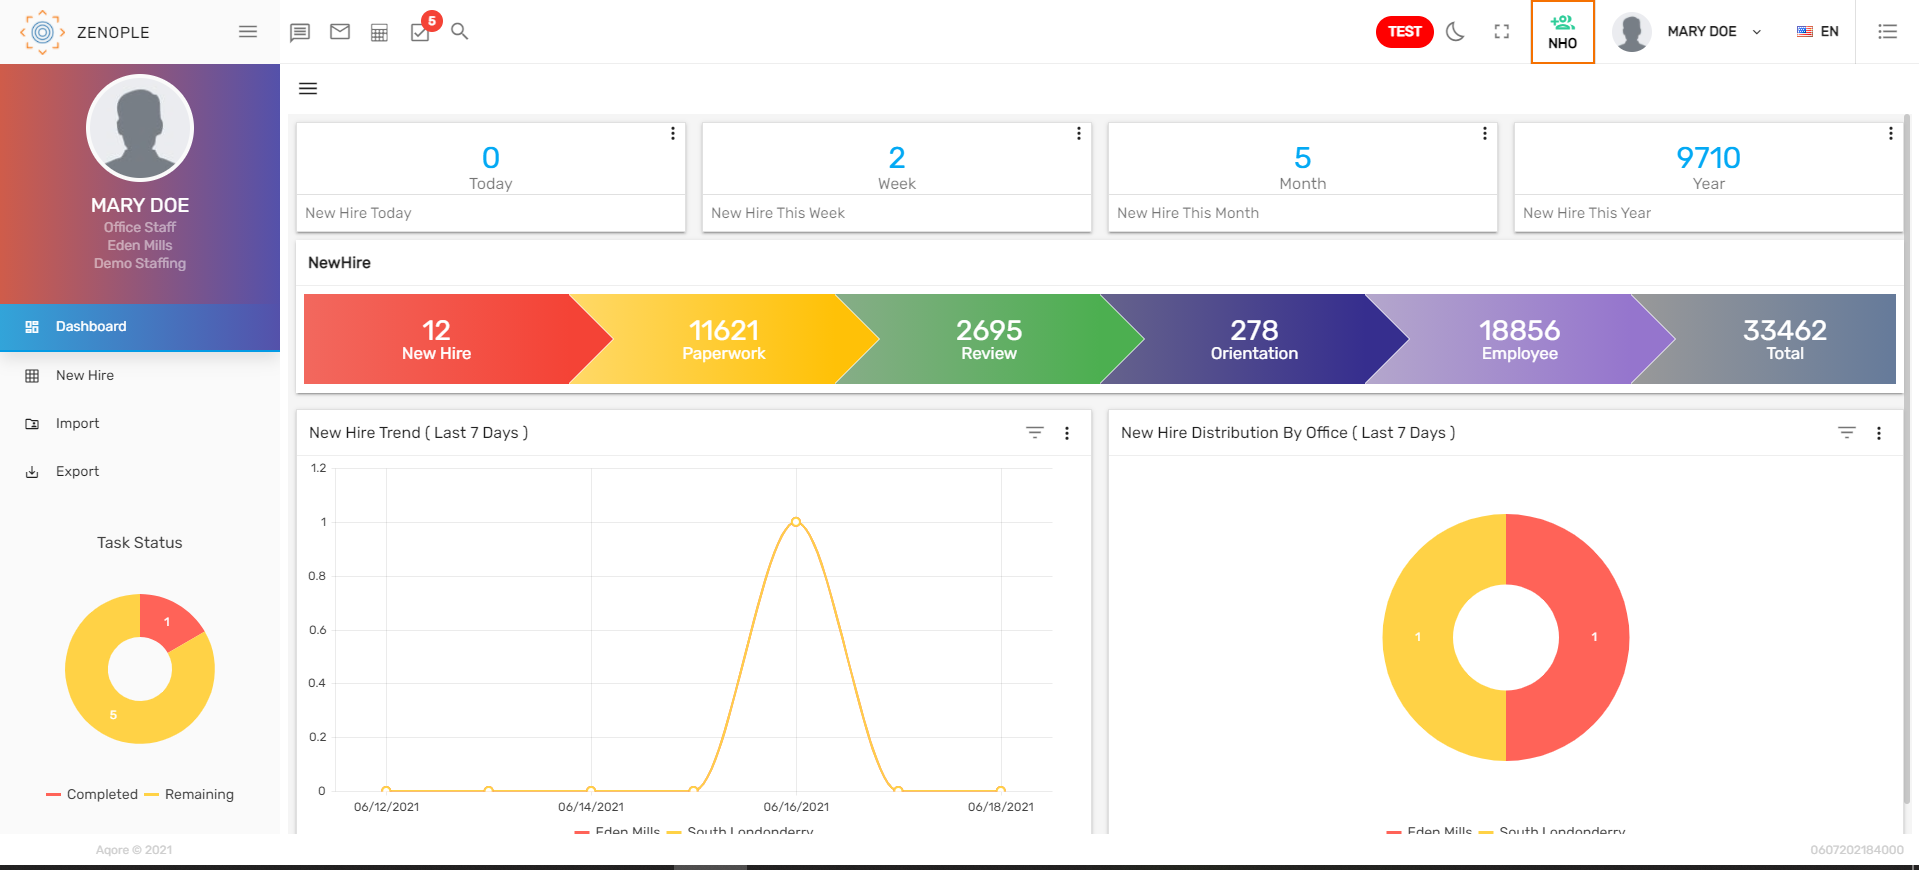
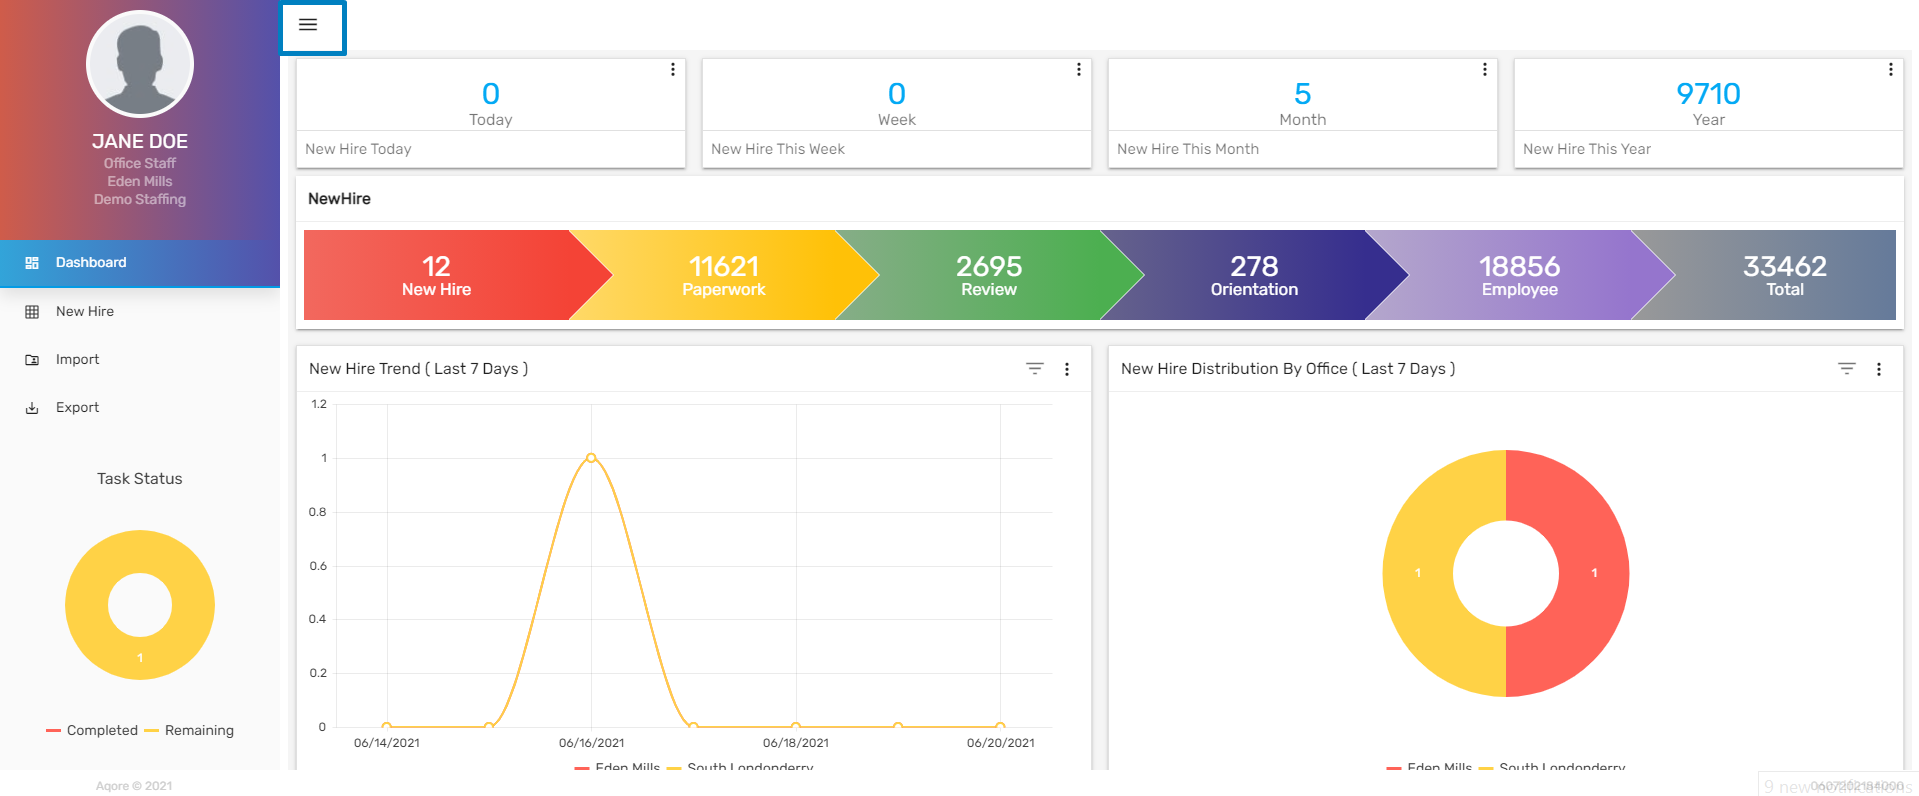
A dashboard displays the various tiles, workflow, and graphs of NHO applications. The dashboard helps in data visualization and analysis.
You can see various tiles, workflows, New-hire trends, and New-hire distribution by office graphs.
Tiles
Tiles are the numeric representation of information. There are various tiles on the top of the screen. With the click of a flip button in each tile, the options are provided to arrange the tile order. On the click of the tile, the users are redirected to the respective page. The session toggle button will appear if the user used the tile to go to the respective page. It will allow the user to access the limited data as per the tile information and if the user turns off the session button then the full list will be displayed. Users can view the information like New hire created today, New hire created this week, etc. Tiles are customizable and can be added upon the user’s request.

Workflow
Here we can see the count of New hires in different stages like New hire, Paperwork, Review, Orientation, and employee.

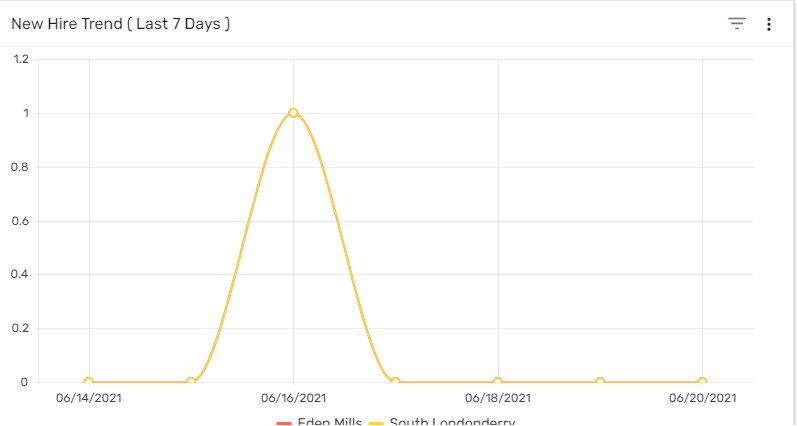
Trend Lines
Trend lines in the dashboard show the graphic comparison of the number of new hires added into the Zenople system according to different offices in a period of time. The default date is set as the 'Last 7 Days.' Users can filter the New Hire Trend line by date like 'Last 7 Days, 'This Week,' 'Last Week,' 'This Month,' 'Last 30 Days,' etc. Also, users can select an office in the trend lines to see the number of new hire records under a particular office in the selected time.
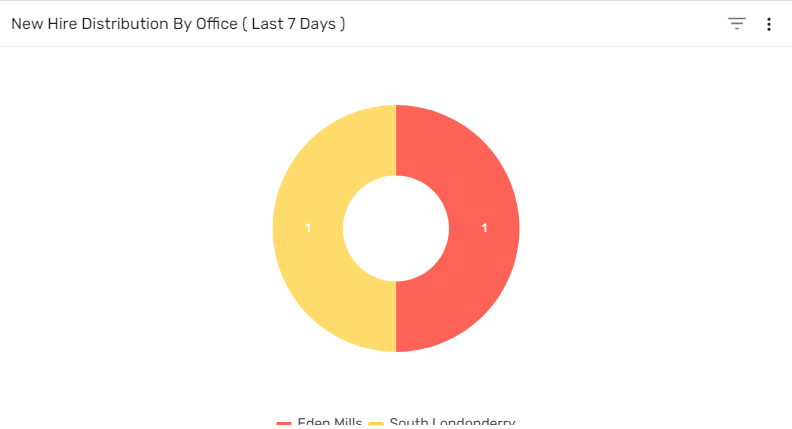
Donut Chart
The donut chart of 'New Hire Distribution by Office' shows the number of new hires as per the office on the selected date. The default date is set as the 'Last 7 Days.' Users can filter the chart of the new hires by date like 'Last 7 Days,' 'This Week,' 'Last Week,' 'This Month,' 'Last 30 Days,' etc. The donut chart is handy for comparing the records and also valuable in concluding quickly.
Filter
NHO includes a dashboard filter option which filters your data using certain categorical filters. Using this filter will display the filtered data based on the selected parameters and values. This filter feature can be used from the hamburger icon.
- Filter Parameter
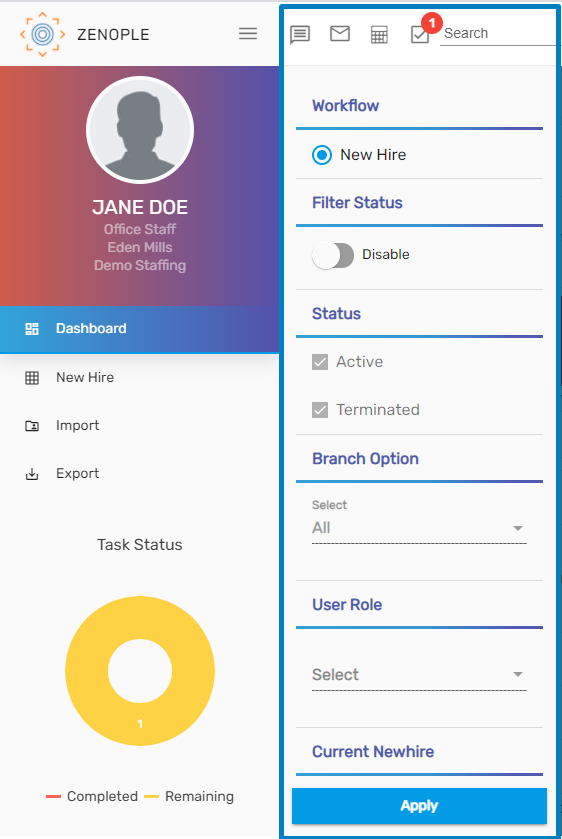
- Workflow
It helps in switching the workflow.
- New hire (Available workflow for now.)
- Filter Status
Filter Status options :
- Enable
- Disable
Note: Enable the filter status, to enable other directory filter options.
- Status
- By selecting the status options available, the new hires will only be listed based on the selected status.
- Branch Option
- All
- My Branch
- Users can choose the branch option and filter dashboard likewise.
- User Role
- New hires can be listed according to the selected user roles. These are customizable upon the organization's request.
- Current New hire
- True
- False
- If the current new hire is set as TRUE, then it shows the list of all current new hires, whereas if it is set as FALSE, then all the new hires who is currently on Employee Stage are displayed as well
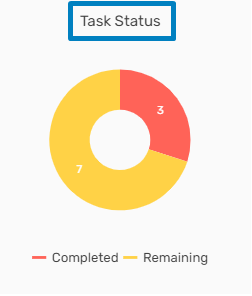
Task Status
Users can view completed and remaining task status in Zenople.