Overview
The first landing page of the Invoice Management System (IMS) is the 'Dashboard.' The dashboard consists of tiles, tabular information with filters, graphs, and donut charts. After landing on the 'Dashboard,' users must select the company and accounting period to view related details.
.png)
Tiles
Tiles are the numeric representation of information. There are various tiles displayed on the dashboard screen which represent the corresponding details. These tiles are customizable as per the organization’s requirements. The various tiles displayed are as follows:
.png)
The information displayed on tiles are:
- Total Bill
- Sales Tax
- Discount
- Charge
- Invoice Amount
- Balance
- Invoice Count
- Correction Count
1. Total Bill
Total regular bill amount of the client.
2. Sales Tax
Total sales tax amount.
3. Discount
Total discount amount is given to the client.
4. Charge
Total charge amount charged to the client
5. Invoice Amount
Total invoice amount. The total invoice amount is calculated by adding the Sales taxes, charges and deducting the discount from the total bill amount.
6. Balance
Total balance amount of the client.
7. Invoice Count
Total number of invoices.
8. Correction Count
Total number of corrections done for the invoices.
Toggle Button
IMS Dashboard consists of two toggle buttons. They are 'Office' and 'Back office.' Enabling the toggle buttons will display the records based on the selected toggle buttons.
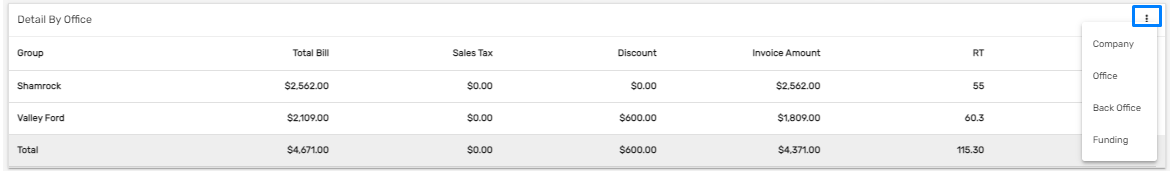
Detailed Table
It consists of tabular information showing 'Total bill,' 'Sales Tax,' 'Discount,' 'Invoice Amount,' 'RT,' 'OT.' This tabular information can be obtained from the vertical ellipsis button based on four options such as 'Detail By Company,' 'Detail By Office,' 'Detail By Back Office,' 'Detail By Funding.' After choosing the required options, tabular information will be displayed as below.
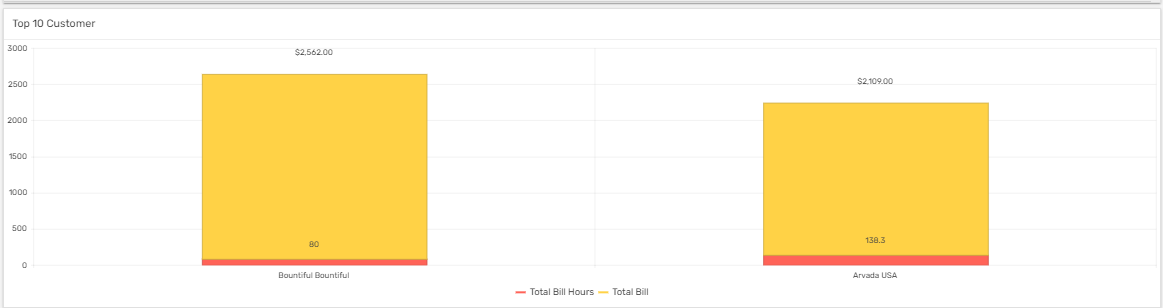
Graph
The bar graph of 'Top 10 Customer' shows the details of the customer’s total bill hours and total bill amount.
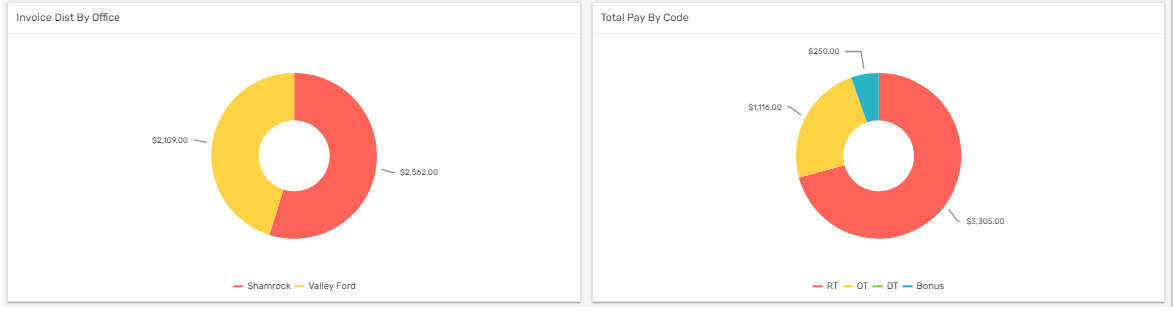
Donut Chart
There are two donut charts in the dashboard, 'Invoice Distribution by office' and 'Total Pay by Code.'
'Invoice Distribution by office' shows the total invoice amount of all the offices of the client individually while 'Total Pay by code' shows the Regular time, Overtime, Double time, and Bonus amount individually as per the selected accounting period and company.