Executive Dashboard
Executive Dashboard in DDS Application
We have created an executive dashboard in the DDS application that consolidates and visualizes key business data for executives. This dashboard provides a comprehensive overview of important metrics such as the AR aging chart, weekly gross profit (GP), key performance indicators (KPI), talent and sales journey insights, and top-performing clients and offices based on gross profit.
Dashboard Components
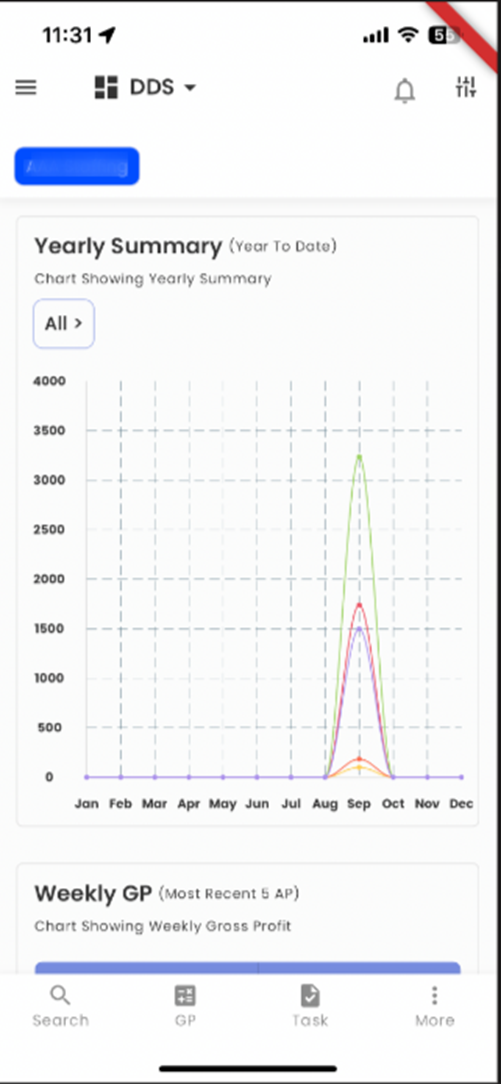
- AR Aging Chart
This chart displays a yearly summary of the company's Accounts Receivable (AR) balance year-to-date. The data includes the following for each month:- Total Bill Amount: Represents the total invoiced amount for the year.
- GP Amount: Shows the Gross Profit amount, calculated as the difference between total bill amount and payroll cost.
- Payroll Cost: The total cost incurred for payroll during the year.
- Total Bill Hour: The total hours billed to clients.
- Gross Profit Percentage (GP%): A ratio of Gross Profit to the Total Bill Amount, indicating the company’s profitability.
- Weekly GP Table
This table shows weekly gross profit (GP) for the most recent five accounting period (AP). The table will display data only for APs with non-zero values, excluding periods with no data. The columns include:- GP: The weekly Gross Profit for the given period.
- GP%: The percentage of Gross Profit relative to the total billing.
- Total Bill: The total billing amount for the AP.
- Payroll Cost: The payroll expenses for the given AP.
- Total Bill Hour: The total hours billed to clients for the AP.
- Key Performance Indicators (KPI)
This section provides an overview of the company’s performance for this year which is from January 1 to today, showing:- Total Bill: The total billed amount for the year.
- Gross Profit: The gross profit generated for the year.
- Billed Hour: The total number of hours billed.
- Contribution: The net financial contribution after factoring all expenses.
- WC Cost: Workers' compensation costs for the year.
- AR Deposit: Accounts Receivable deposits recorded this year.
- Employer Tax: Taxes paid by the employer.
- Gross Profit per Hour: The gross profit divided by the total bill hours, showing profitability per hour worked.
- Time to Fill: The average number of days it takes to fill a job.
- Fill Ratio: The ratio of jobs filled to the total number of jobs posted.
- Turnover: The employee turnover rate.
- GPP: Gross Profit Percentage.
- Actively Working: The number of employees currently active.
- Missed Opportunity: Jobs not filled or potential business that was not converted.
- Injured: The number of employee injuries recorded.
- Other KPI shows the data from start of the year to till date which includes metrics such as:
- Client Metrics (active client, idle client, overdue client, over-limit client): Shows the current status of the client base.
- Job Metrics (open, in-progress, filled jobs): Displays the status of job postings.
- Employee Metrics (total, active, inactive, placed direct hire employees): Tracks the current status of employees, including those rehired, re-onboarded, new hires, and archive new hires.
- Talent Journey Chart
This chart visualizes the talent journey, tracking how long it takes for a candidate to move from the Applicant Tracking System (ATS) to New Hire Orientation (NHO). The chart covers the time from January 1 to today and reflects the efficiency of the talent acquisition process. - Sales Journey Chart
This chart mirrors the talent journey, but it tracks sales progression. It displays the number of days taken for sales opportunities to move from Lead Tracking System (LTS) to Client Management System (CMS) for the current year. - Top Ten Clients Table
This table ranks the top ten clients based on gross profit (GP) for the current year. It includes:- GP: The gross profit generated by the client.
- GP%: The percentage of GP relative to the total business generated.
- Total Bill: The total billing from the client.
- Payroll Cost: The total payroll cost associated with the client’s business.
- Total Bill Hour: The total hours billed to the client.
- Top Five Clients by Business Percentage Chart
This chart ranks the top five clients by the percentage of business generated based on gross profit for current year. It visually highlights the clients that contribute the most to overall revenue and profitability. - Top Ten Offices Table
This table lists the top ten offices for the current year based on gross profit (GP). It provides a breakdown of:- GP: The gross profit earned by each office.
- GP%: The gross profit percentage relative to the total business.
- Total Bill: The total billing for each office.
- Payroll Cost: The total payroll cost for each office.
- Total Bill Hour: The total hours billed by each office.
- Top Five Offices by Business Percentage Chart
This chart shows the top five offices based on the percentage of business generated, highlighting the most productive offices in terms of GP for the current year. - Talent Sourcing Chart
This chart tracks talent sourcing for the year, displaying how talent is brought into the system. It provides insights into the most effective channels for sourcing talent and offers a breakdown of where talent is being acquired.
Additionally, the dashboard comes equipped with advanced filtering options, allowing users to refine the data displayed according to their specific needs.
Advanced Filter Functionality
The executive dashboard also includes advanced filtering options that allow users to customize and refine the data displayed based on specific criteria. Users can:
- Select a Company: Use a dropdown menu to select a specific company, thereby filtering the dashboard to display data for that company only.
- Filter by Office: Choose a specific office from the dropdown to focus on metrics relevant to that office.
- AP From and AP To Filters: Specify a date range by selecting the “AP From” and “AP To” filters to view data for a specific accounting period. This allows users to analyze data for a particular time frame, ensuring precision in reporting.
All of the above charts and tables will reflect unfiltered data when no filters are applied. However, when the user applies filters through the dropdown menus and date selection, the dashboard dynamically updates to display data corresponding to the chosen company, office, or accounting period.
Chart/Table Name | Company filter | Office filter | AP filter |
AR-aging | TRUE | TRUE | FALSE |
Weekly GP | TRUE | TRUE | TRUE |
KPI | N/A | N/A | N/A |
KPI Client/Job/Employee Metrics | TRUE | TRUE | TRUE |
Talent Journey | TRUE | TRUE | TRUE |
Sales Journey | TRUE | TRUE | TRUE |
Top Ten Client | TRUE | TRUE | TRUE |
Top Five Client by business % | TRUE | TRUE | TRUE |
Top Ten Office | TRUE | TRUE | TRUE |
Top Five Office business % | TRUE | TRUE | TRUE |
Talent Sourcing | TRUE | TRUE | TRUE |
This enhanced dashboard empowers users to both view broad business trends and drill down into specific details through advanced filtering options, offering a fully customizable and interactive reporting experience.