Summary
The Management Report provides a comprehensive, company and office level executive overview of staffing operations for a selected date range of accounting period. It consolidates payroll, billing, tax, and gross profit data across all companies and offices into a single, structured report, making it the primary tool for branch managers, managers and executives to monitor business health briefly.
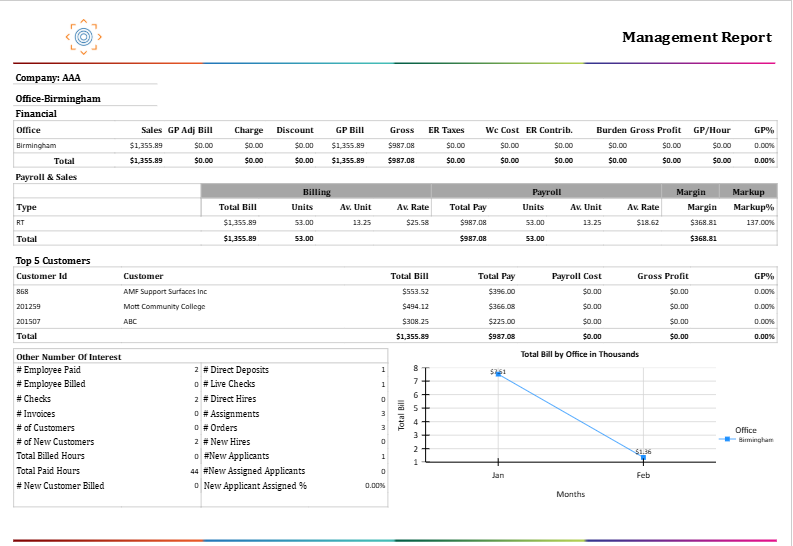
The report is organized hierarchically: data flows from individual Office sections, Rolls up to Company Totals, and culminates in a Report Total that spans all companies. Each office section contains four distinct data areas: Financial Summary, Payroll & Sales, Payroll Taxes, and Other Numbers of Interest along with a Top 5 Customers table and a Total Bill trend chart.
This report is essential for:
Branch Managers: Monitor office-level billing, payroll, margin, and gross profit on a weekly or period basis.
Executives & Owners: Track company-wide financial performance, identify top-performing offices, and compare month-over-month billing trends.
Finance & Accounting: Reconcile employer tax burdens, WC costs, and gross profit figures against payroll batches.
Operations Teams: Track workforce metrics including new hires, assignments, direct deposits, and applicant conversion rates.
By centralizing financial and operational data in one view, the Management Report enables faster decision-making around pricing strategy, client prioritization, and resource allocation across the entire organization.
Report Overview
Attribute | Details |
Purpose | Provides a multi-level executive summary of billing, payroll, taxes, gross profit, and operational metrics. Organized by Office, Company, and Report Total, it enables period-based financial review and performance benchmarking across all offices and company. |
Classification | Business-Critical Report |
Who Should Use This Report | Branch Managers, Company Executives, Finance & Accounting, Operations Managers |
Business Problem Solved | Consolidates billing, payroll, employer taxes, WC costs, burden, and gross profit data in one view, eliminating the need to cross-reference multiple reports to assess office and company financial performance. |
Run Frequency | Weekly or per accounting period; also run at month-end for financial close and executive review. |
Related Reports | Gross Profit Detail, Gross Profit Summary |
Business Value
Category | Description |
Financial Performance Monitoring | Tracks billing, payroll, margin, and markup by pay type (RT/OT/DT/Bonus) per office, enabling period-level performance review. |
Gross Profit Visibility | Presents GP Bill, ER Taxes, WC Cost, ER Contributions, Burden, and final Gross Profit in a single financial table per office. |
Tax & Burden Analysis | Breaks down both Employer and Employee taxable gross and tax amounts for FIT, SIT, CITY, FICA, MEDI, FUTA, and SUTA per office. |
Trend Analysis | Month-over-month Total Bill by Office trend charts allow managers to visualize billing growth or decline across the period. |
Customer Insights | Surfaces the Top 5 Customers by total bill per office and per company, including payroll cost, gross profit, and GP%. |
Workforce Intelligence | Tracks headcount metrics including employees paid/billed, new hires, assignments, direct hires, applicants, and customer counts. |
Known Issues or Limitations
Issues | Description |
Top 5 Customers may not match across levels | Top 5 Customers shown at the Office level are ranked by that office's billing. Company Total and Report Total each re-rank customers across their respective scope, so the same customer may appear in different positions. |
Billing trend chart limited to top 5 offices | The Total Bill by Office trend chart at the Report Total level only plots the top 5 offices by total billing within the period. |
New Customer count may differ from expectations | A customer is counted as 'New' if they were not billed in the 12 months prior to the report start date. This rolling 12-month lookback may include customers already known to users. |
Troubleshooting Guide
Issues | Problem Reason | Solution |
No data displayed for an office | Transaction batch not closed or no transactions posted in the period | Verify that the payroll/invoice batch has been fully closed within the selected accounting period date range. |
Payroll Taxes show unexpected values | Cumulative YTD tax logic includes adjustments from prior periods | Cross-reference with the Payroll Tax Summary report for the same period to verify individual transaction-level detail. |
Top 5 Customers table is empty | No invoiced transactions exist for that office in the period | Confirm invoices have been posted and linked to the selected office within the accounting period. |
New Hires count seems too high | New Hires counts all employees whose first assignment start date falls in the period | Filter by office and verify assignment start dates in the employee profile if the count seems unexpected. |
Trend chart shows only one data point | Only one month of data exists in the selected date range | Widen the date range to span at least two calendar months to generate a trend line. |
FAQ
Questions | Answers |
Why does the Gross Profit% differ between the office level and company total? | Each level recalculates GP% independently based on its aggregated GP Bill and Gross Profit values. Rounding at each level can cause minor differences between office, company, and report total GP%. |
What does 'New Applicant Assigned %' represent? | It is the percentage of new applicants (those whose profile was created within the period) who were also assigned to at least one job during the same period. Formula: (New Assigned Applicants / New Applicants) * 100. |
What is the difference between 'Gross' and 'Gross Profit' in the financial table? | 'Gross' is the total employee wages (Sum for Earnings category transactions). 'Gross Profit' is the net result after subtracting all payroll costs including ER Taxes, WC Cost, Burden, and ER Contributions from the GP Bill. |
What counts as a 'Direct Hire'? | A Direct Hire is an employee whose assignment was created as a Direct Hire placement (not a temp assignment) with an insert date falling within the selected period. |
Can I filter this report by a specific customer or employee? | No. The Management Report is filtered only by Company and Office. For customer- or employee-level detail, use the Gross Profit Detail report with the appropriate Group By selection. |
Reference Video/Screenshot
Report Details
Category | Value |
Parent Category | BackOffice |
Category | BO Management |
Report Type | Paginated Report |
Report runs from Application | RMS |
Report Category: | Shareable |
Report Level | Transaction |
Report Parameters
Report Parameter | Description | Parameter Options | Default | Required |
Start Date (AP) | Filters records by the accounting period start date | Any valid date | Yes | |
End Date (AP) | Filters records by the accounting period end date | Any Valid Date | Yes | |
Company | Filters records by the selected company (or all companies the user has access to) | List of companies accessible to the user | All | No |
Office | Filters records by the selected office within the chosen company | List of offices for the selected company | All | No |
Report Grouping
Company
Office
Report Columns
Report Column | Description | Definition/Logic |
Office | Office name | The name of the staffing office for which the data is displayed. |
Sales | Total billing revenue | Sum of Item Bill for all transaction items with an Earnings category. Represents the total amount invoiced to customers for labor. |
GP Adj Bill | Gross Profit Adjustment — Bill side | Sum of Item Bill for transaction codes that are NOT in the Earnings category but are configured with 'Is GP Calculation = Yes'. These are billing adjustments that affect gross profit. |
Charge | Additional charges applied to the invoice | Sum of charge amounts applied to invoice transactions within the period. Added to the GP Bill calculation. |
Discount | Discount amounts applied to the invoice | Sum of discount amounts applied to invoice transactions. Deducted from the GP Bill calculation. |
GP Bill | Gross Profit Bill — the revenue base used for GP calculation | Calculated as: Sales + Charge + GP Adj Bill - Discount. |
Gross | Total employee wages | Sum of Item Pay for all transaction items with an Earnings category for Employee-type workers. Represents gross wages paid before taxes and deductions. |
ER Taxes | Total Employer Tax cost | Sum of all employer-side payroll taxes (FICA, MEDI, FUTA, SUTA) computed per transaction. Calculated as: Pay Percent Transaction * tax for each tax type, rounded to 4 decimal places. |
WC Cost | Workers' Compensation cost | Calculated as: WC Wage * WC Rate. WC Wage is derived from the employee's gross pay adjusted by the WC Code processing method (Regular Gross or Full Gross). WC Rate comes from the WC Code rate configuration. |
ER Contrib. | Employer Benefit Contributions | Sum of employer-paid benefit amounts (e.g., health insurance, retirement) tagged in the payment transactions within the period. Calculated as: Pay Percent Transaction * Benefit, rounded to 2 decimal places. |
Burden | Office-level overhead burden cost | Calculated as: (Burden Rate / 100) * Gross. The Burden Rate is defined at the Office level in ATM via the Option Property 'Burden Rate'. Result is rounded to 2 decimal places. |
Gross Profit | Net gross profit earned by the office | Calculated as: Sales + Charge + GP Adj Bill - Discount - Payroll Cost - Rebate – Credit Card Fee - GP Adj Pay. Where Payroll Cost = Gross + ER Taxes + Burden + WC Cost + ER Contrib. |
GP/Hour | Gross Profit per billed hour | Calculated as: Gross Profit / Total Billed Hours. Indicates the profitability per unit of labor billed. |
GP% | Gross Profit as a percentage of GP Bill | Calculated as: (Gross Profit / GP Bill) * 100. Rounded to 2 decimal places. |
Type | Pay type category (Payroll & Sales section) | The pay type associated with the transaction: RT (Regular Time), OT (Overtime), DT (Double Time), or Bonus. |
Total Bill (by Type) | Total billed amount for the pay type | Sum of Item Bill for all transaction items of the given pay type with Earnings category. |
Units (Bill) | Total billed units (hours or quantity) | Sum of Bill Unit for transaction items where Item Bill is non-zero, for the given pay type. |
Av. Unit (Bill) | Average billed units per transaction | Total Bill Units / count of transactions for the pay type. |
Av. Rate (Bill) | Average bill rate | Total Bill Amount / Total Bill Units. Represents the average hourly or unit bill rate charged to the customer. |
Total Pay (by Type) | Total payroll amount for the pay type | Sum of Item Pay for all transaction items of the given pay type with Earnings category. |
Units (Pay) | Total paid units (hours or quantity) | Sum of Pay Unit for transaction items where Item Pay is non-zero, for the given pay type. |
Av. Unit (Pay) | Average paid units per transaction | Total Pay Units / count of transactions for the pay type. |
Av. Rate (Pay) | Average pay rate | Total Pay Amount / Total Pay Units. Represents the average hourly or unit pay rate paid to the employee. |
Margin | Gross margin amount (Payroll & Sales section) | Calculated as: Total Bill - Total Pay for the given pay type. Represents the gross dollar spread between billing and payroll. |
Markup% | Markup percentage | Calculated as: (Total Bill / Total Pay) * 100. Rounded to the nearest whole percent. Represents how much the bill rate exceeds the pay rate as a percentage. |
Transaction Type | Tax category (Payroll Taxes section) | The type of payroll tax: FIT (Federal Income Tax), SIT (State Income Tax), CITY (Local/City Tax), FICA (Social Security), MEDI (Medicare), FUTA (Federal Unemployment), SUTA (State Unemployment). |
Employer — Taxable Gross | Taxable wage base for employer-side taxes | The cumulative taxable gross wages subject to employer tax for each tax type within the period. FUTA and SUTA are subject to wage base caps; FICA and MEDI apply to full gross. |
Employer — Tax | Employer tax amount | The employer-side tax computed for each tax type. Calculated as: Pay Percent Transaction * applicable tax rate, summed across all transactions in the period. |
Employee — Taxable Gross | Taxable wage base for employee-side taxes | The employee's cumulative taxable gross wages subject to each tax type. FIT and SIT reflect year-to-date totals and may appear as large negative values due to tax withholding computation logic. |
Employee — Tax | Employee tax withholding amount | The employee-side tax withheld for each tax type. FIT and SIT withholding amounts may be negative as they represent deductions from employee pay. |
# Employee Paid | Number of unique employees who received a paycheck | Count of distinct Employees linked to payments within closed transaction batches for the office in the period. |
# Employee Billed | Number of unique employees who were billed to a customer | Count of distinct Employees linked to invoices within closed transaction batches for the office in the period. |
# Checks | Total number of payment records issued | Count of distinct Payment Ids (both live checks and direct deposits) within closed transaction batches for the office. |
# Invoices | Number of invoices generated | Count of distinct Invoice Ids linked to transactions within the period for the office. |
# of Customers | Number of unique customers billed | Count of distinct Organization Ids linked to invoiced transactions within the period for the office. |
# of New Customers | Number of new customer relationships established | Count of distinct customers (Organization Ids) whose first billing with the office occurred within the selected period, regardless of whether an invoice was generated. |
Total Billed Hours | Sum of all hours billed to customers | Sum of Total Bill Hours from Transaction Summary for transactions linked to invoices within the period. |
Total Paid Hours | Sum of all hours paid to employees | Sum of Total Pay Hours from Transaction Summary for all closed transactions within the period. |
# New Customer Billed | New customers who were actually invoiced in the period | Count of distinct customers first invoiced within the period, who had no billing recorded in the 12 months prior to the report start date. |
# Direct Deposits | Number of payments made via direct deposit (ACH) | Count of distinct Payment Ids where Is Live Check = 0 within closed transaction batches for the office. |
# Live Checks | Number of payments made via live (paper) check | Count of distinct Payment Ids where Is Live Check = 1 within closed transaction batches for the office. |
# Direct Hires | Number of direct hire placements made | Count of distinct employees on Direct Hire-type assignments whose assignment insert date falls within the selected period. |
# Assignments | Total number of active assignments | Count of distinct Assignment Ids linked to transactions within the period. |
# Orders | Total number of job orders filled | Count of distinct Job Ids linked to transactions within the period. |
# New Hires | Number of new employees placed on assignment | Count of distinct employees whose first-ever assignment start date falls within the selected period. |
# New Applicants | Number of new applicant profiles created | Count of distinct Person Ids for applicants whose profile insert date falls within the selected period for the office. |
# New Assigned Applicants | New applicants who were also placed on an assignment | Count of distinct Person Ids from the New Applicants pool who also received at least one assignment during the same period. |
New Applicant Assigned % | Percentage of new applicants who were successfully placed | Calculated as: (New Assigned Applicants / New Applicants) * 100. Indicates recruiter effectiveness in converting new applicants to placements. |
Customer Id | Unique customer identifier (Top 5 Customers section) | The system-assigned ID for the customer (Organization Id). |
Customer | Customer name | The name of the customer organization. |
Total Bill (Customer) | Total amount billed to the customer | Sum of Total Bill (including Charge, Discount, and Sales Tax adjustments) for all transactions linked to the customer within the period. |
Total Pay (Customer) | Total payroll paid for work at the customer | Sum of Total Pay for all transactions linked to the customer within the period. |
Payroll Cost | Total fully loaded payroll cost for the customer | Sum of Payroll Cost = Gross + ER Taxes + Burden + WC Cost + ER Contributions for transactions linked to the customer. |
Additional Notes
The report uses Accounting Period Date on the Transaction record. Only transactions within fully closed batches whose Accounting Period falls between Start Date and End Date are included. |
Data is presented at three levels — Office, Company Total (aggregation of all offices within a company), and Report Total (aggregation across all companies). Each level independently recalculates all metrics. |
Burden is an overhead allocation calculated at the Office level using the Burden Rate option property configured in ATM. If Burden Rate is not set for an office, Burden will be $0.00. |
Offices configured for contractor (1099) workers may show $0.00 for ER Taxes and Gross Profit if tax and burden configurations are not set up for that office type. |